Tracking in ParaView
Goal: how to analysis tracking data in paraview
1 Imspector: open your image in Imspector
![]()
2 Minflux Data panel → select data set on Data source panel → Compile trace data (Trace data compiled on the bottom of Minflux Data panel) → then Launch Paraview ![]()
3 ParaView:
3.1 Localizations: show the dots where molecules were localized:
- loc: localization coordinate; in raw data: determined position of the respective localization in x, y and z
- cfr: center frequency ratio; emission frequency measured at the center pattern position (= efc) divided by emission frequency measured at pattern positions on the circle (= efo)
- dcr: detection channel ratio; emission frequency measured on detector 1 divided by emission frequencies measured on detector 1 + detector 2
- fbg: fluorescence background; determined background level (as count frequency) in the sample
- efo: effective frequency at offset tcp position; emission frequency measured at the pattern positions on the circle (= ”offset”; not in the center position)
- tid: trace ID/identifier
- tim: time; timepoint of localization acquisition in respect to start of the measurement (in seconds)
- itr: iteration
3.2 ExtracBlock1”: the connection between localizations
- Hover Cells on (green triangle): if you click one of the traces this will show you ( block, trace, ID, type, spd, dst)

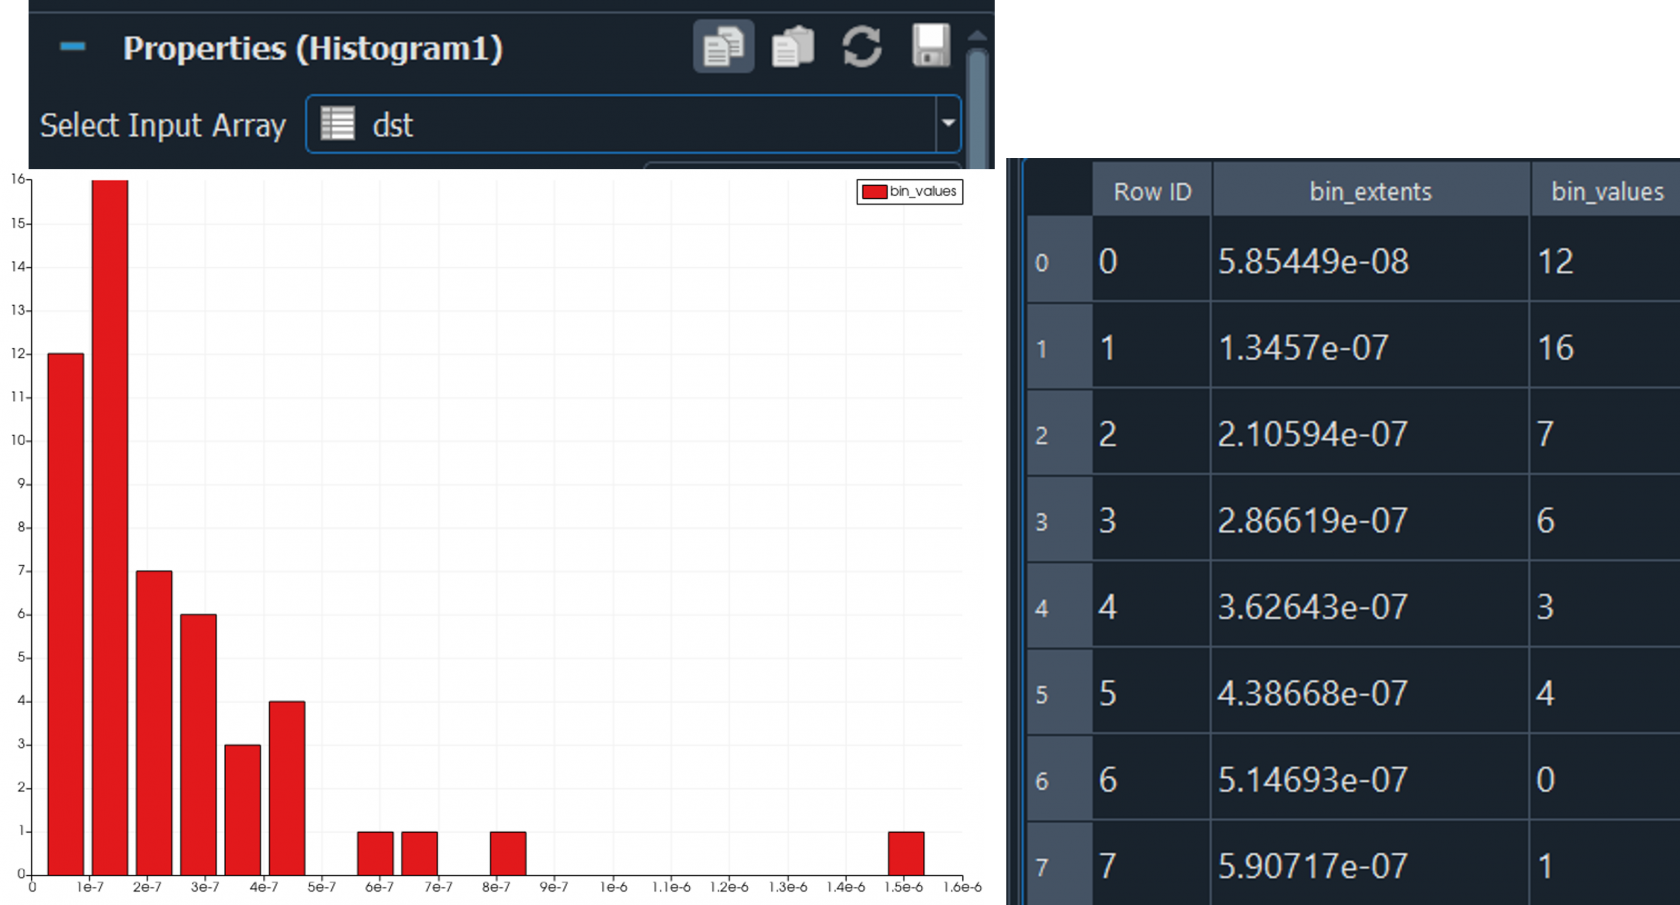
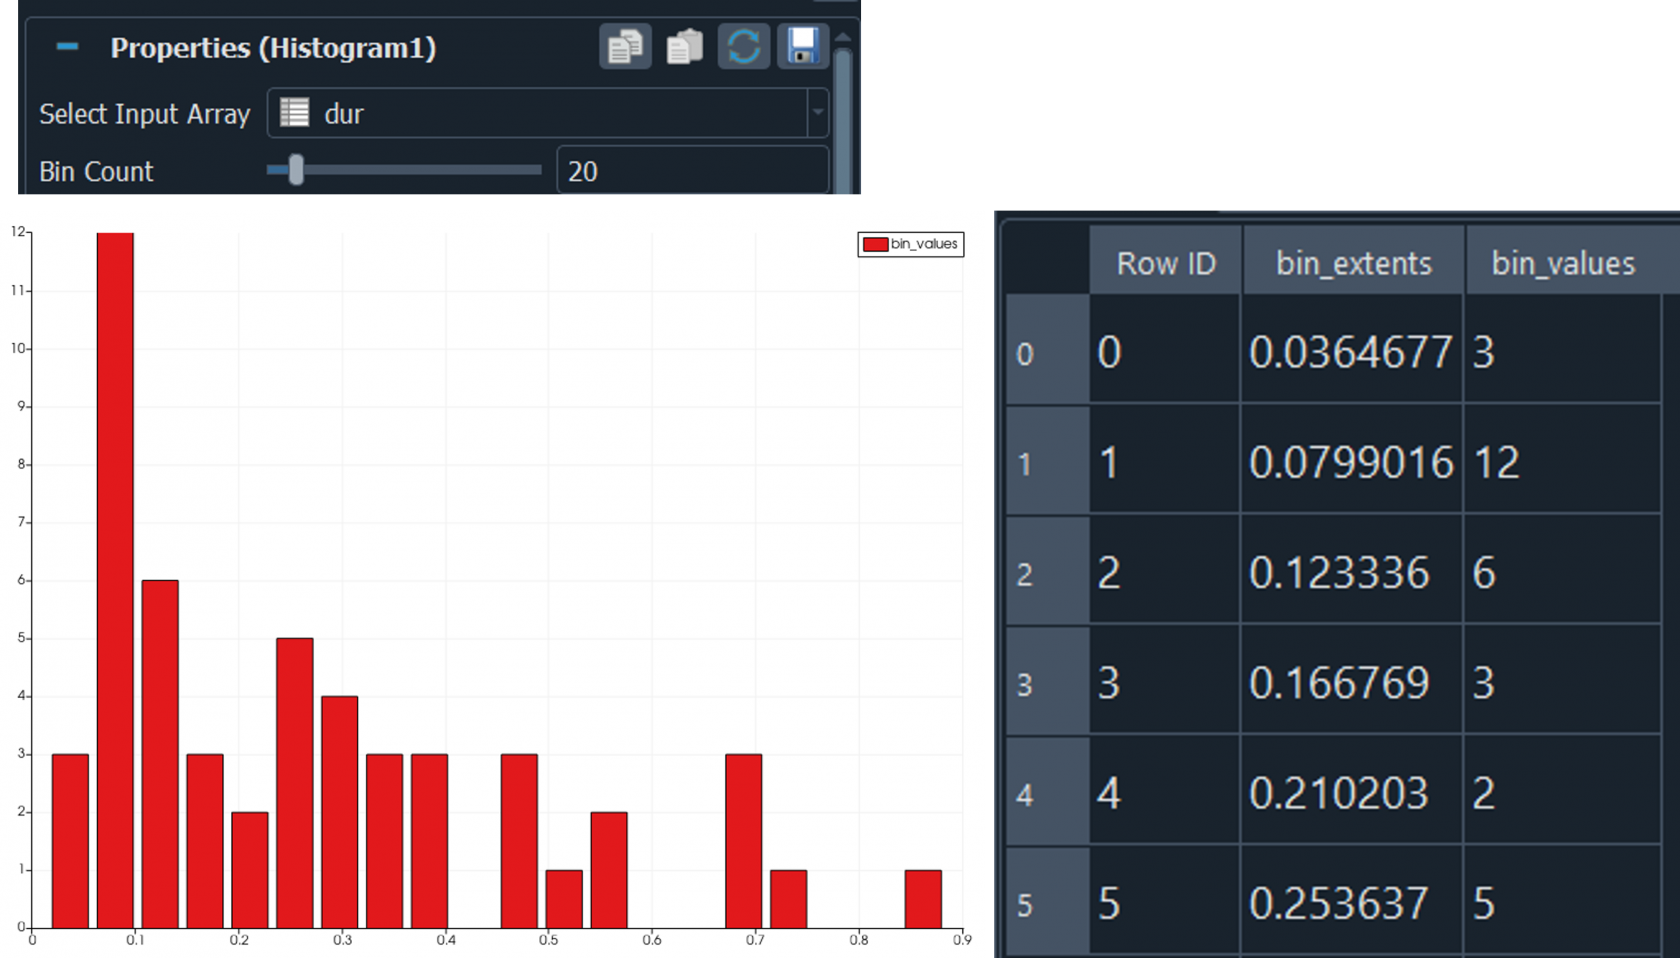
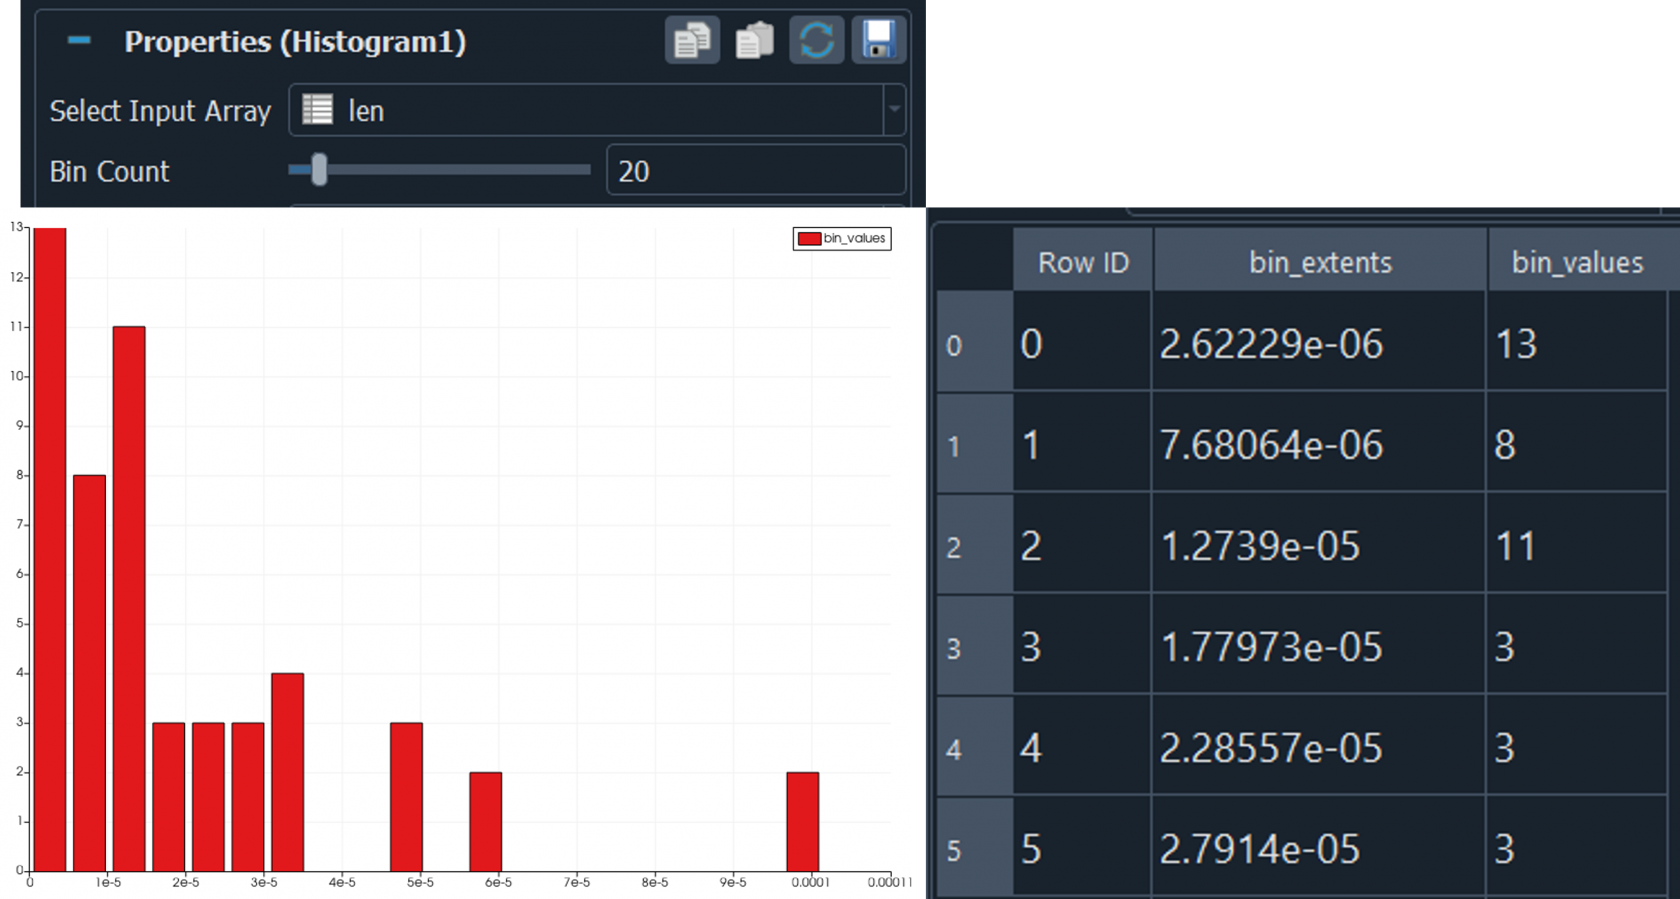
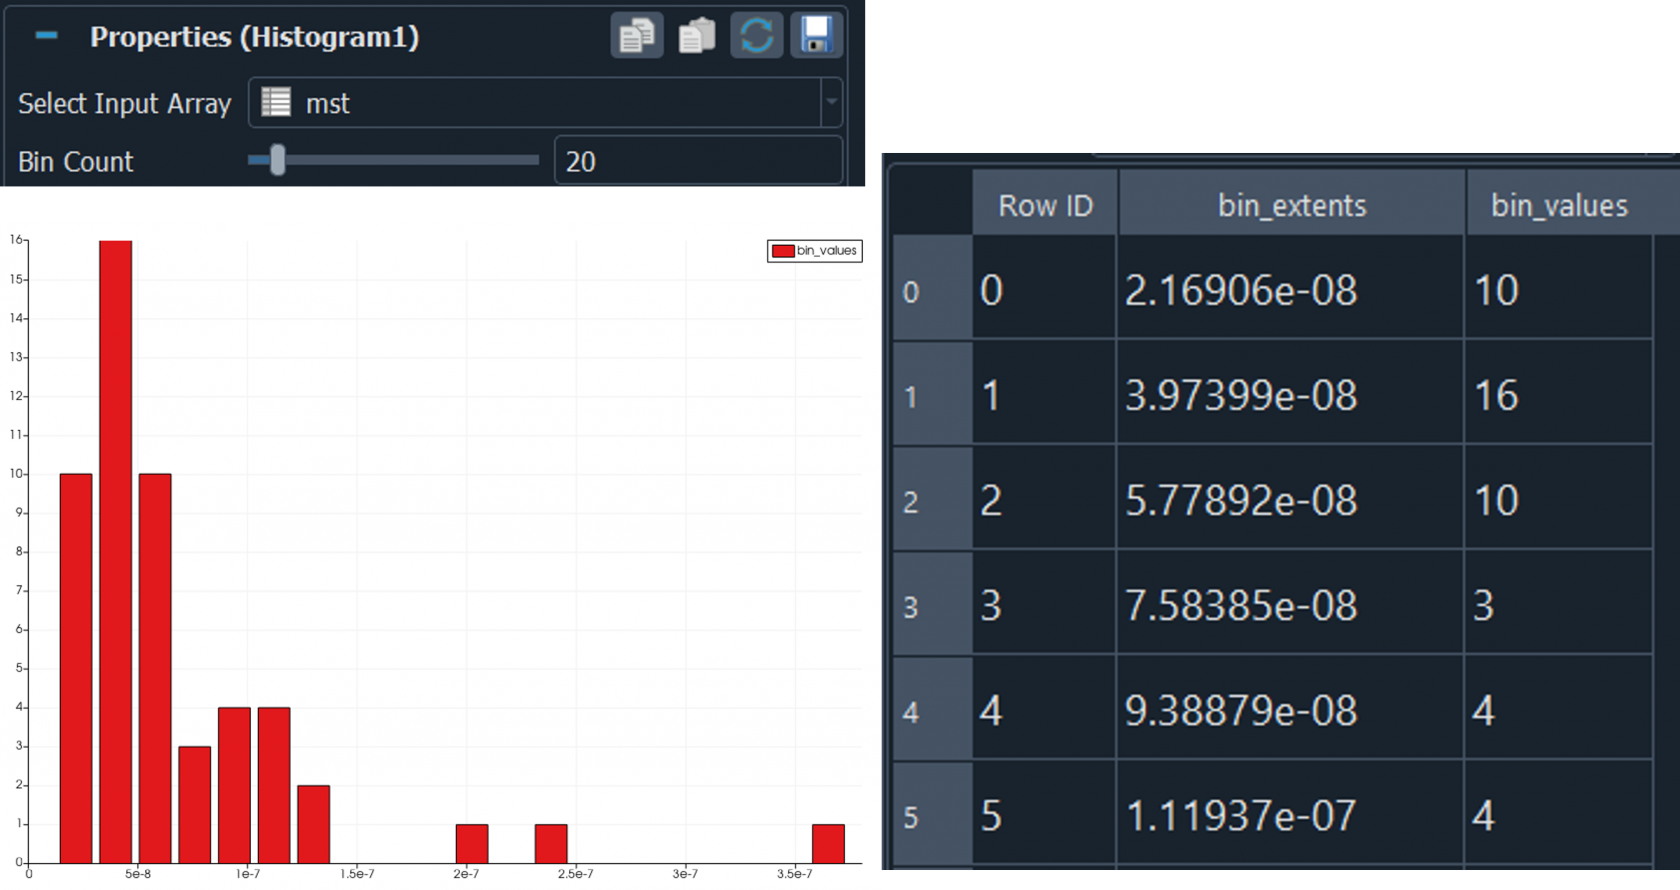
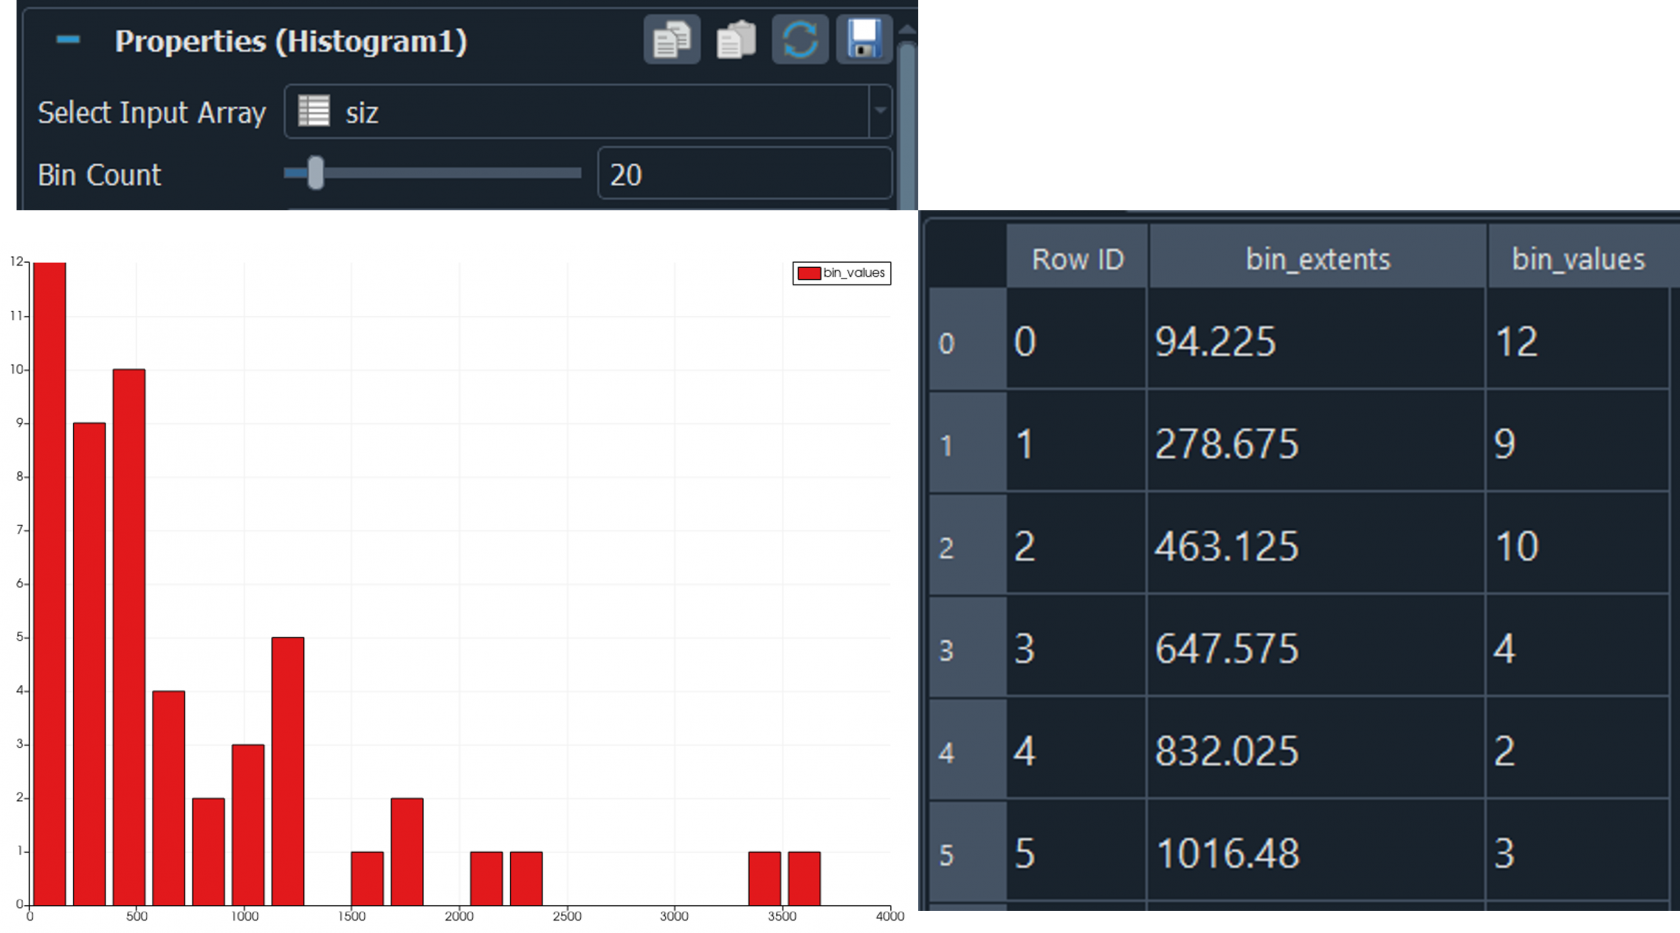
4 Traces →Histogram → select input Array (dst, dur, gri, len, mst, siz, tid, tim)
- Dst: distance from the start point to the end point (it does not follow all the traces)
- Dur: duration is the total time of the track in second
- Gri: Grid is scanning point in iteration 0 (this not necessary for histogram)
- Len is the length of completed trace (this is different from dst)
- mst????
- Size is the number of localizations in the trace
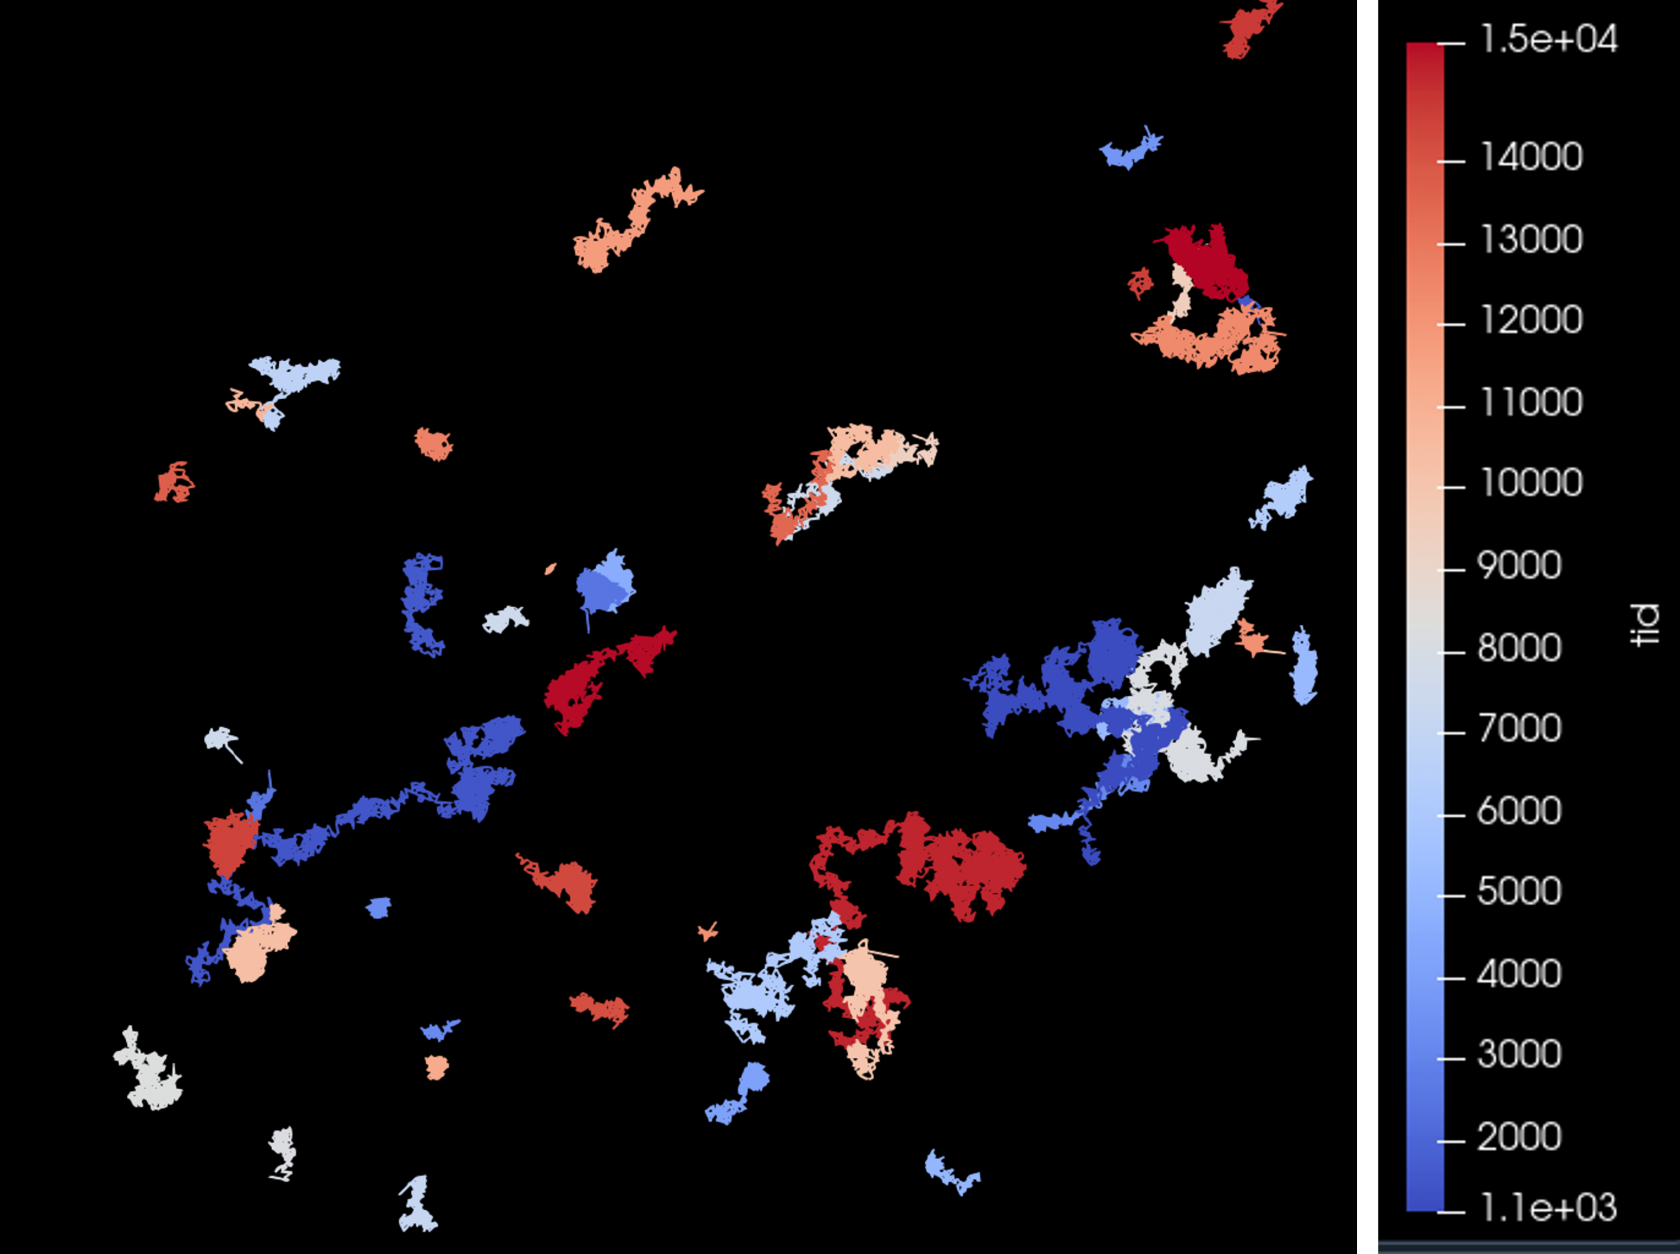
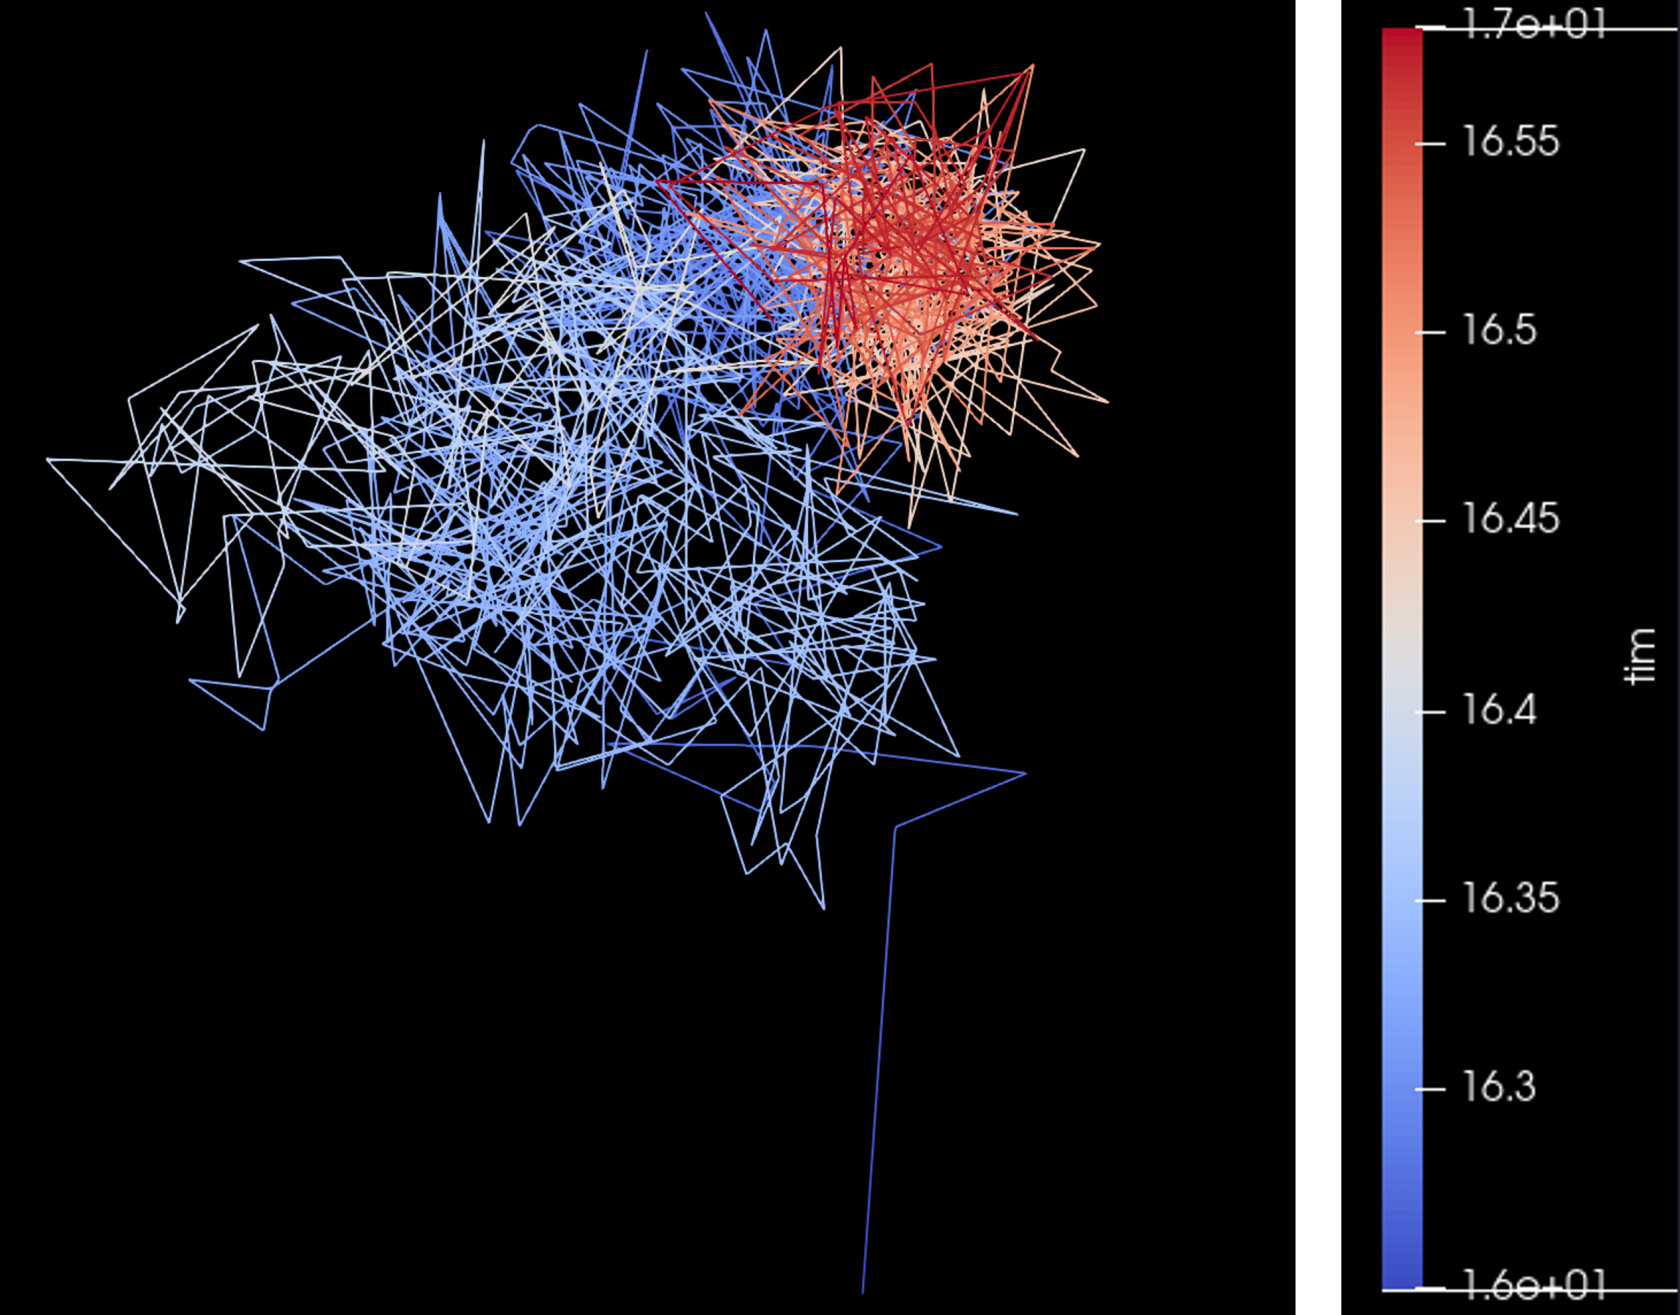
5 Traces →ExtraBlock1
- Loc: Location of each track, you can color coding based on X, Y or Z
- Tid: random color coding of the traces, by using the traces ID, this similar with Imspector
- Tim: each localization on the track is color coded regarding the time start of the trace to the end of the trace, (blue to red color coding means blue is the start of the trace and red is the end of the trace). Note: the first localization to the second seem longer than other track
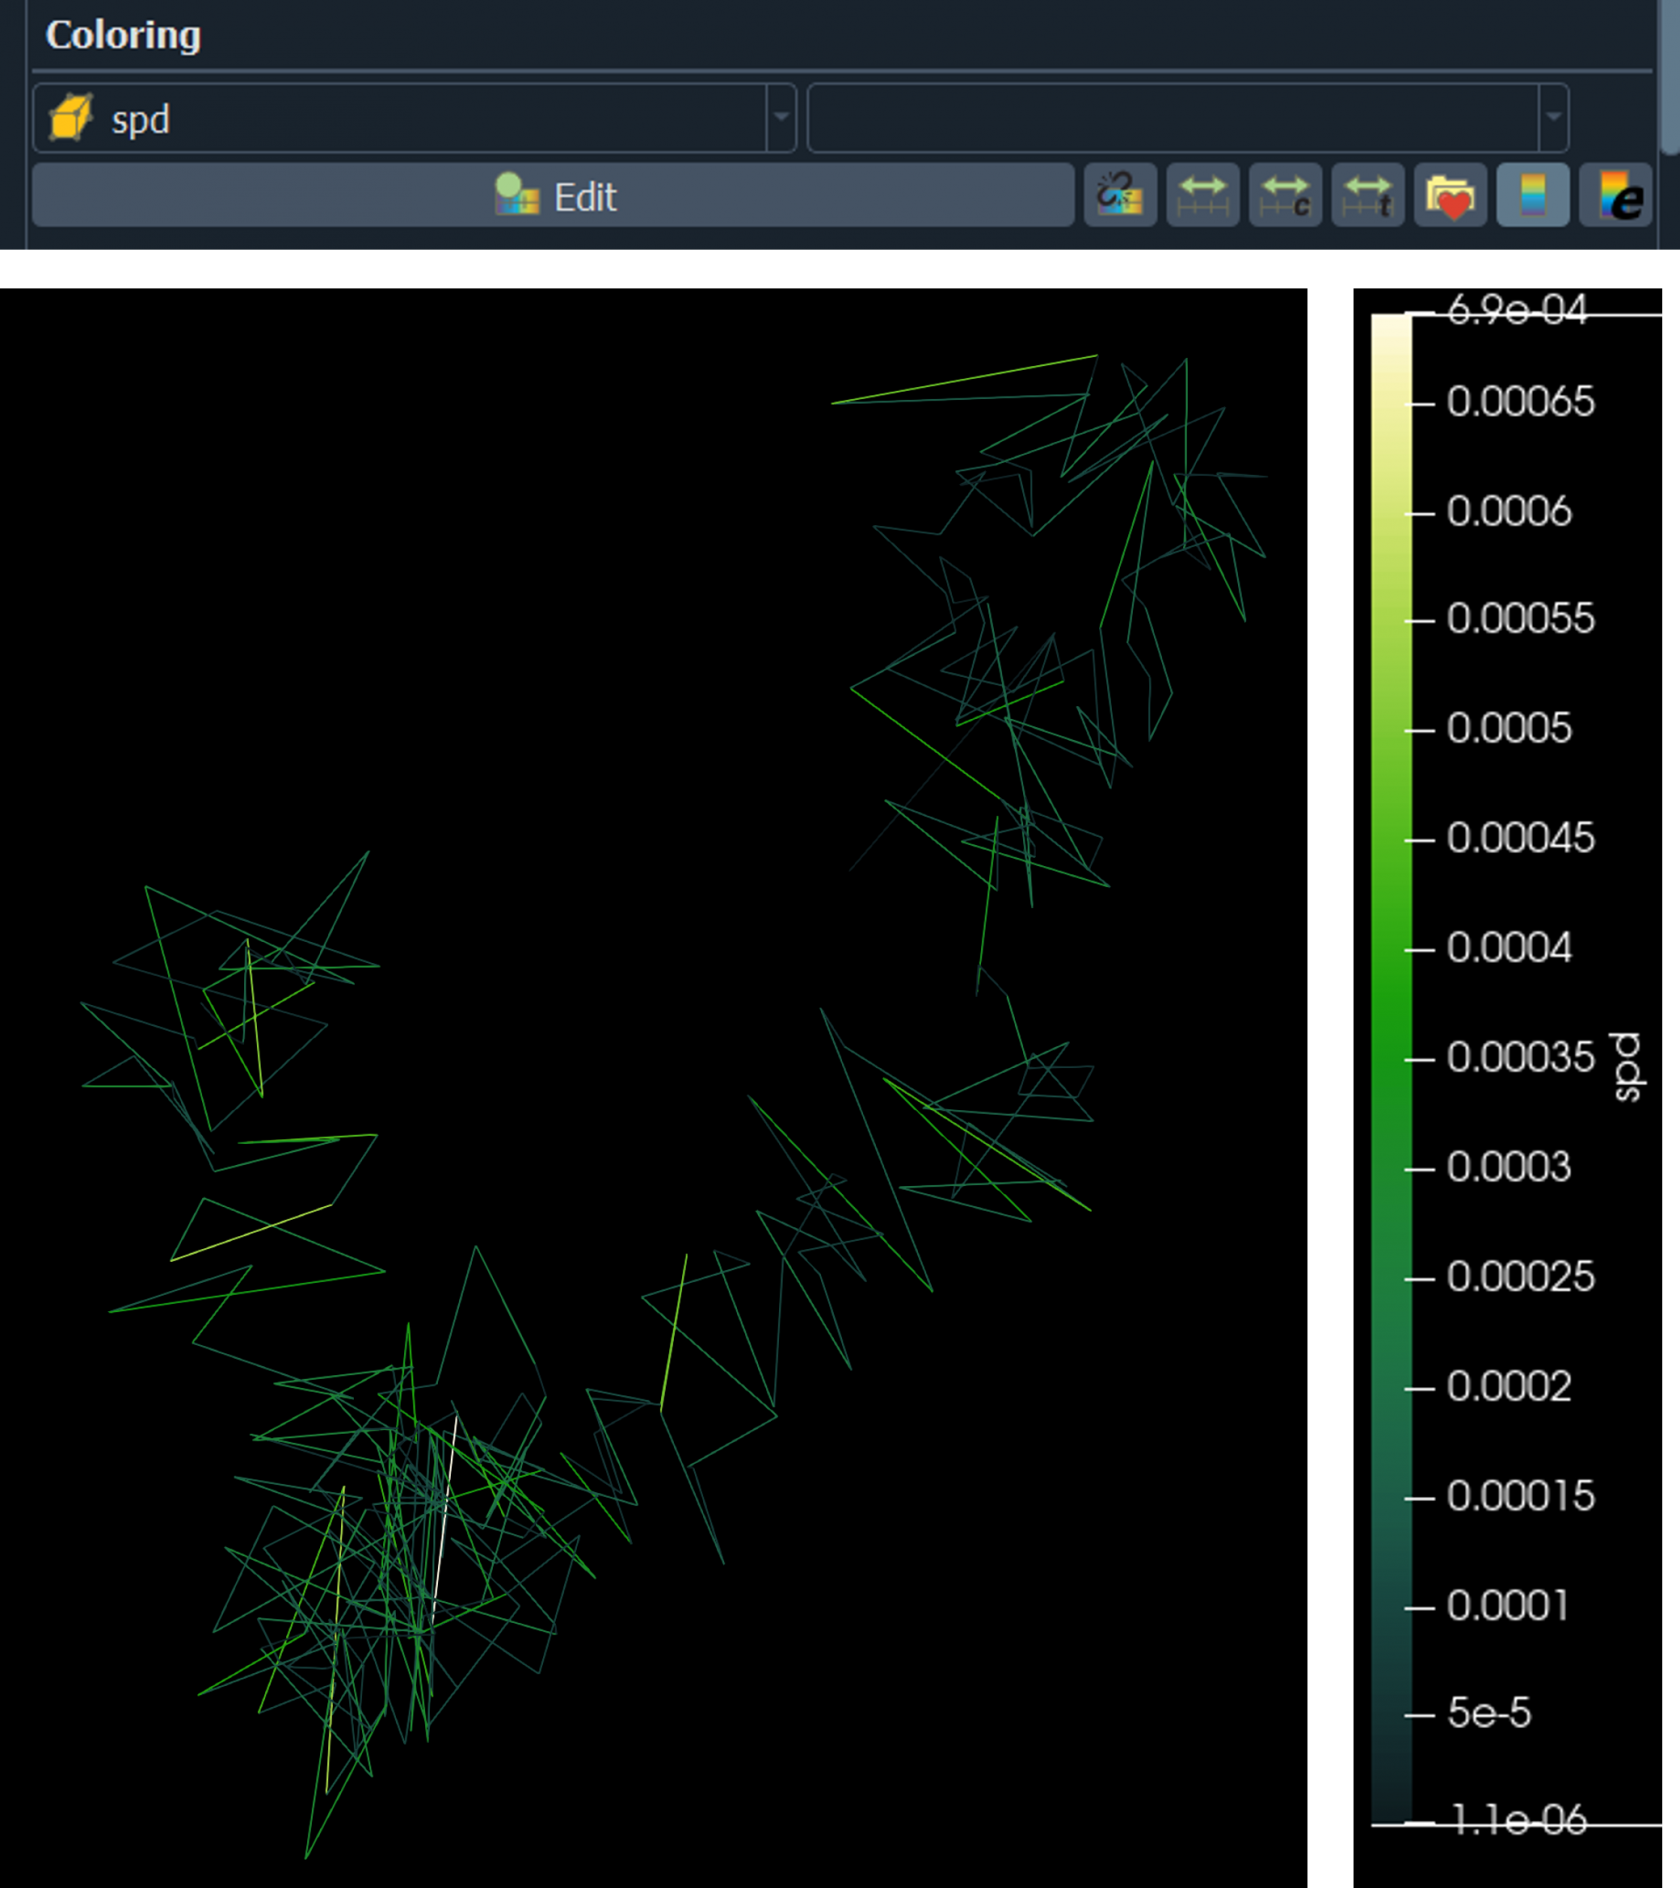
- Dst: distance from the start to the end point. Below by using Linear-Green color map show that dark green is the shortest and the white is the longest distance from start localization to the end point/localization.
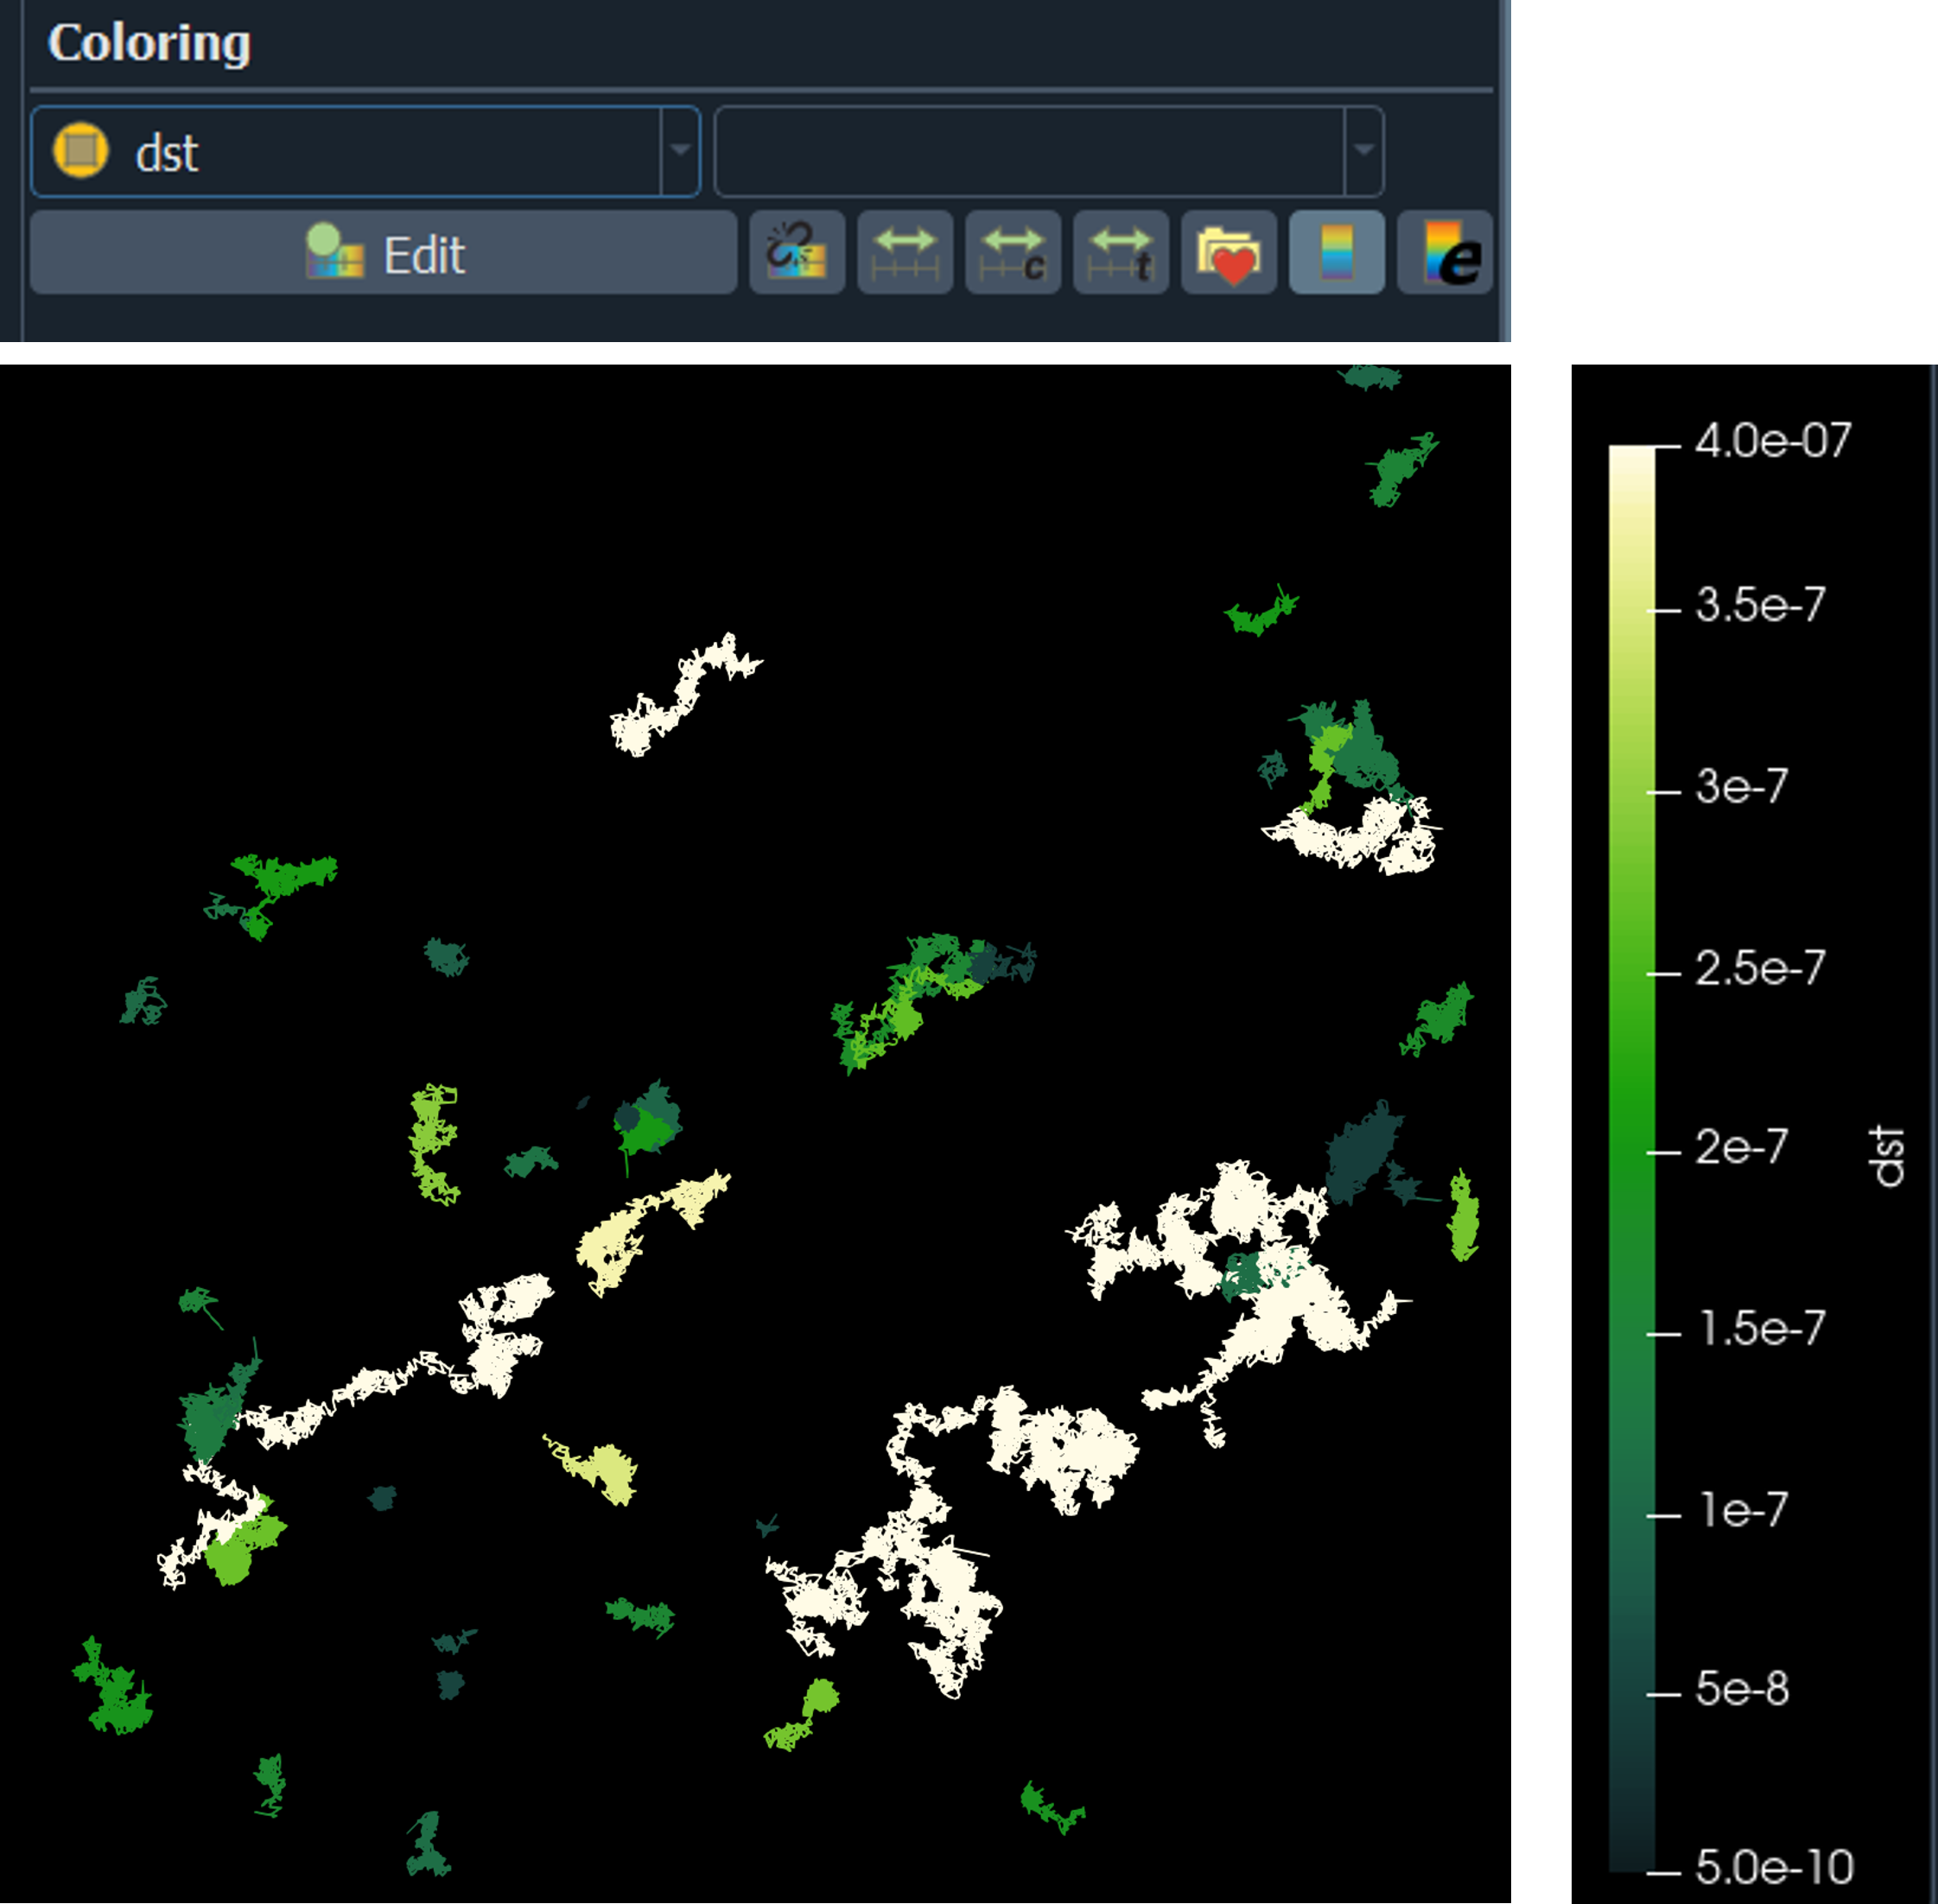
-
Dst: length between two localizations, the figure we choose one trace dark green is the shortest distance and the white is the longest distance.
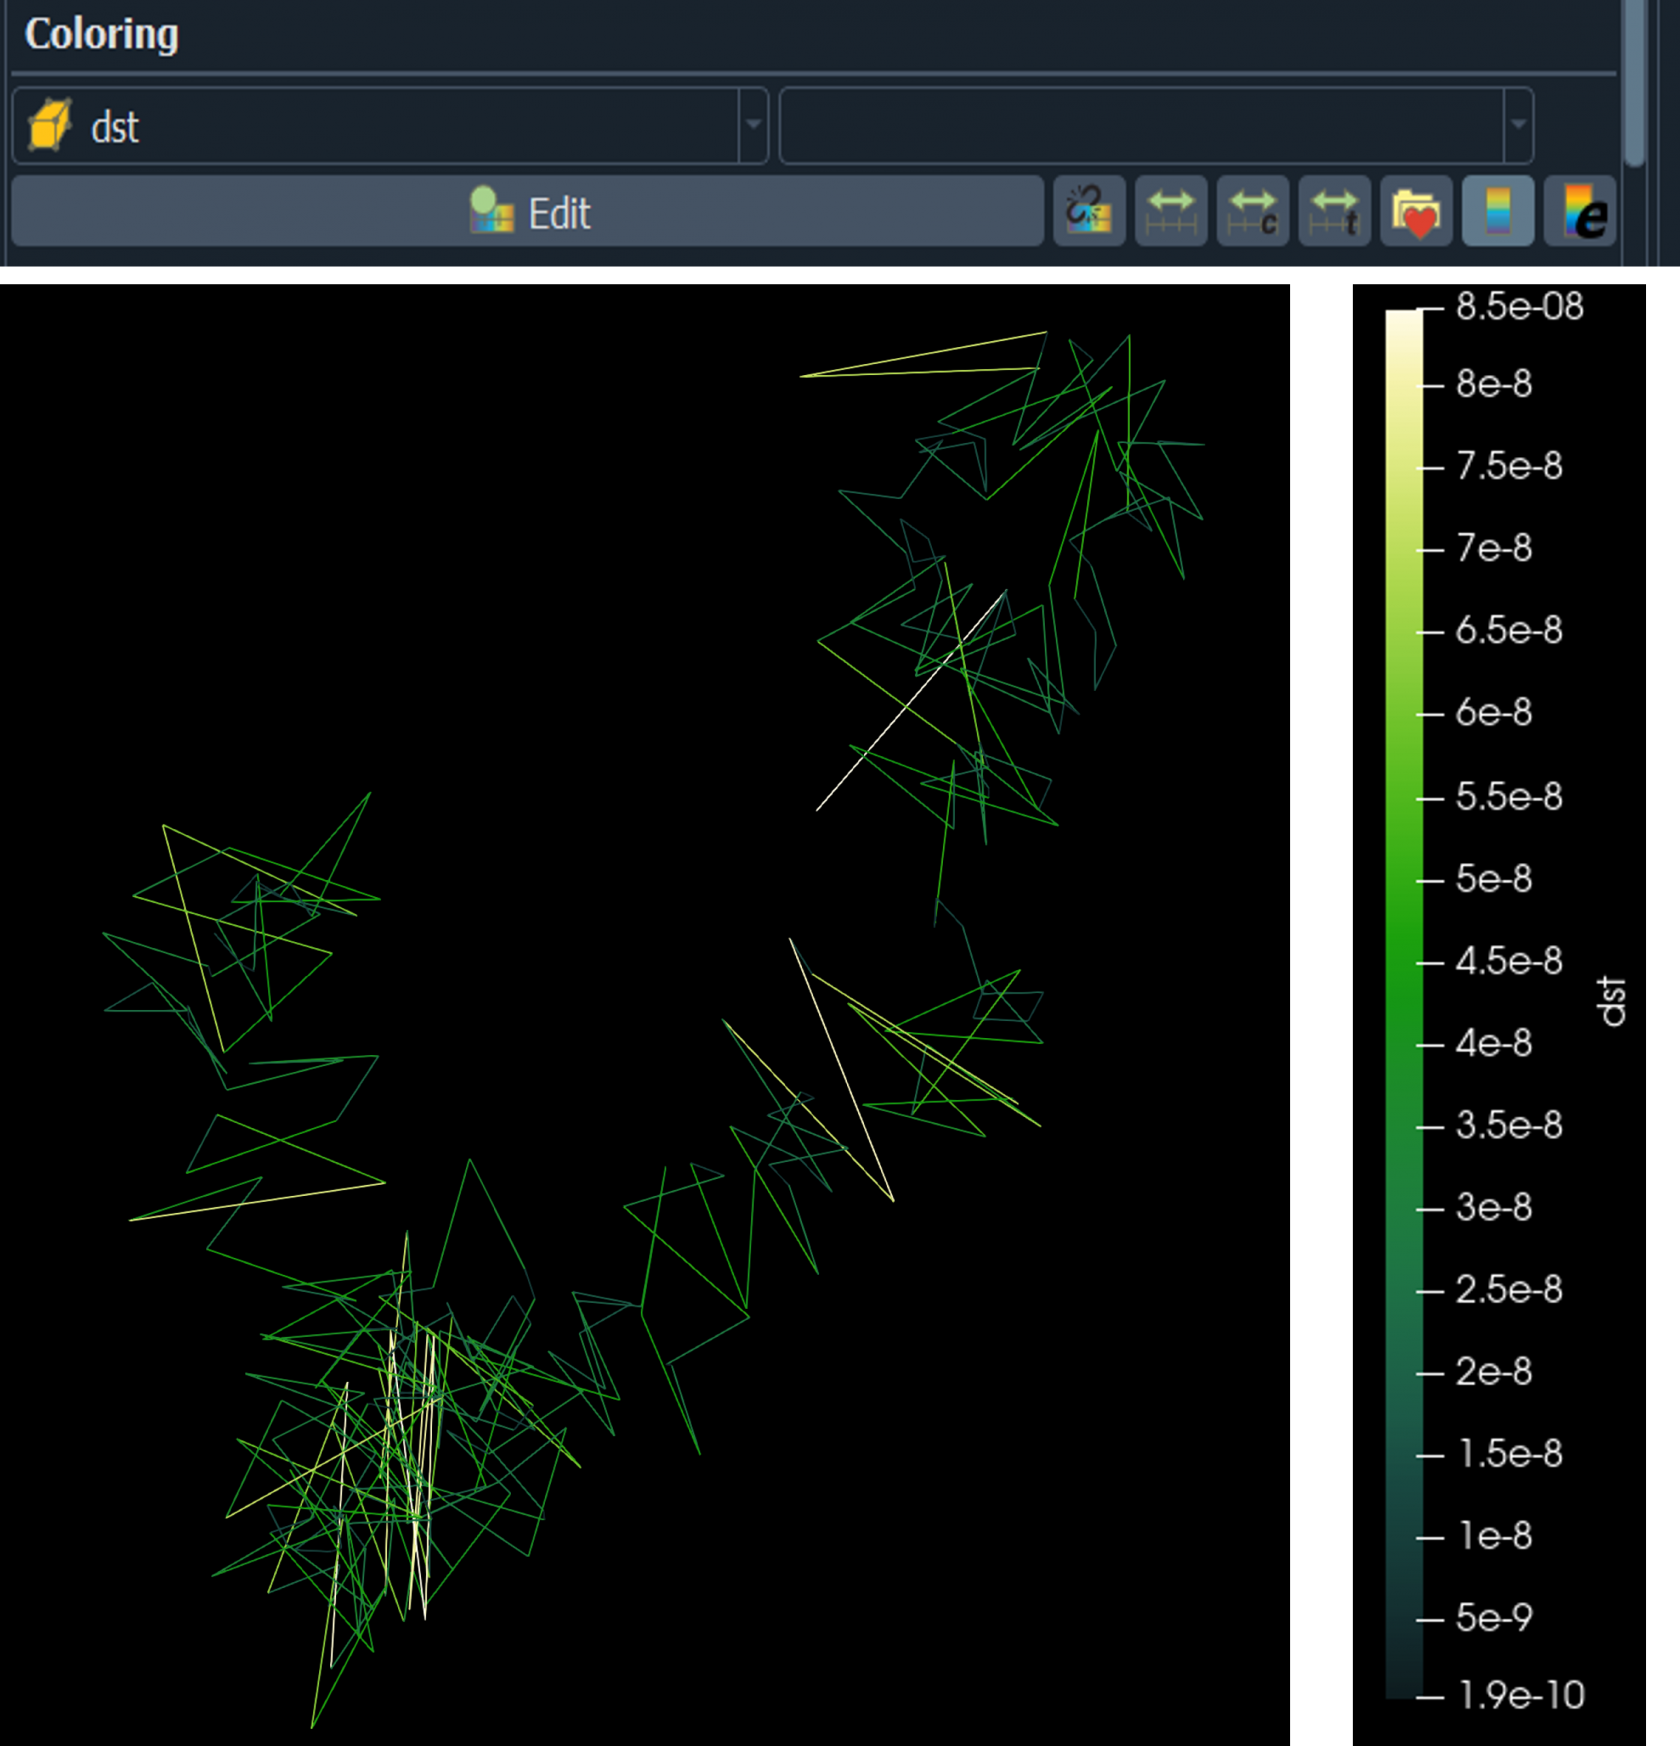
- Spd: distance between 2 localizations divided by time