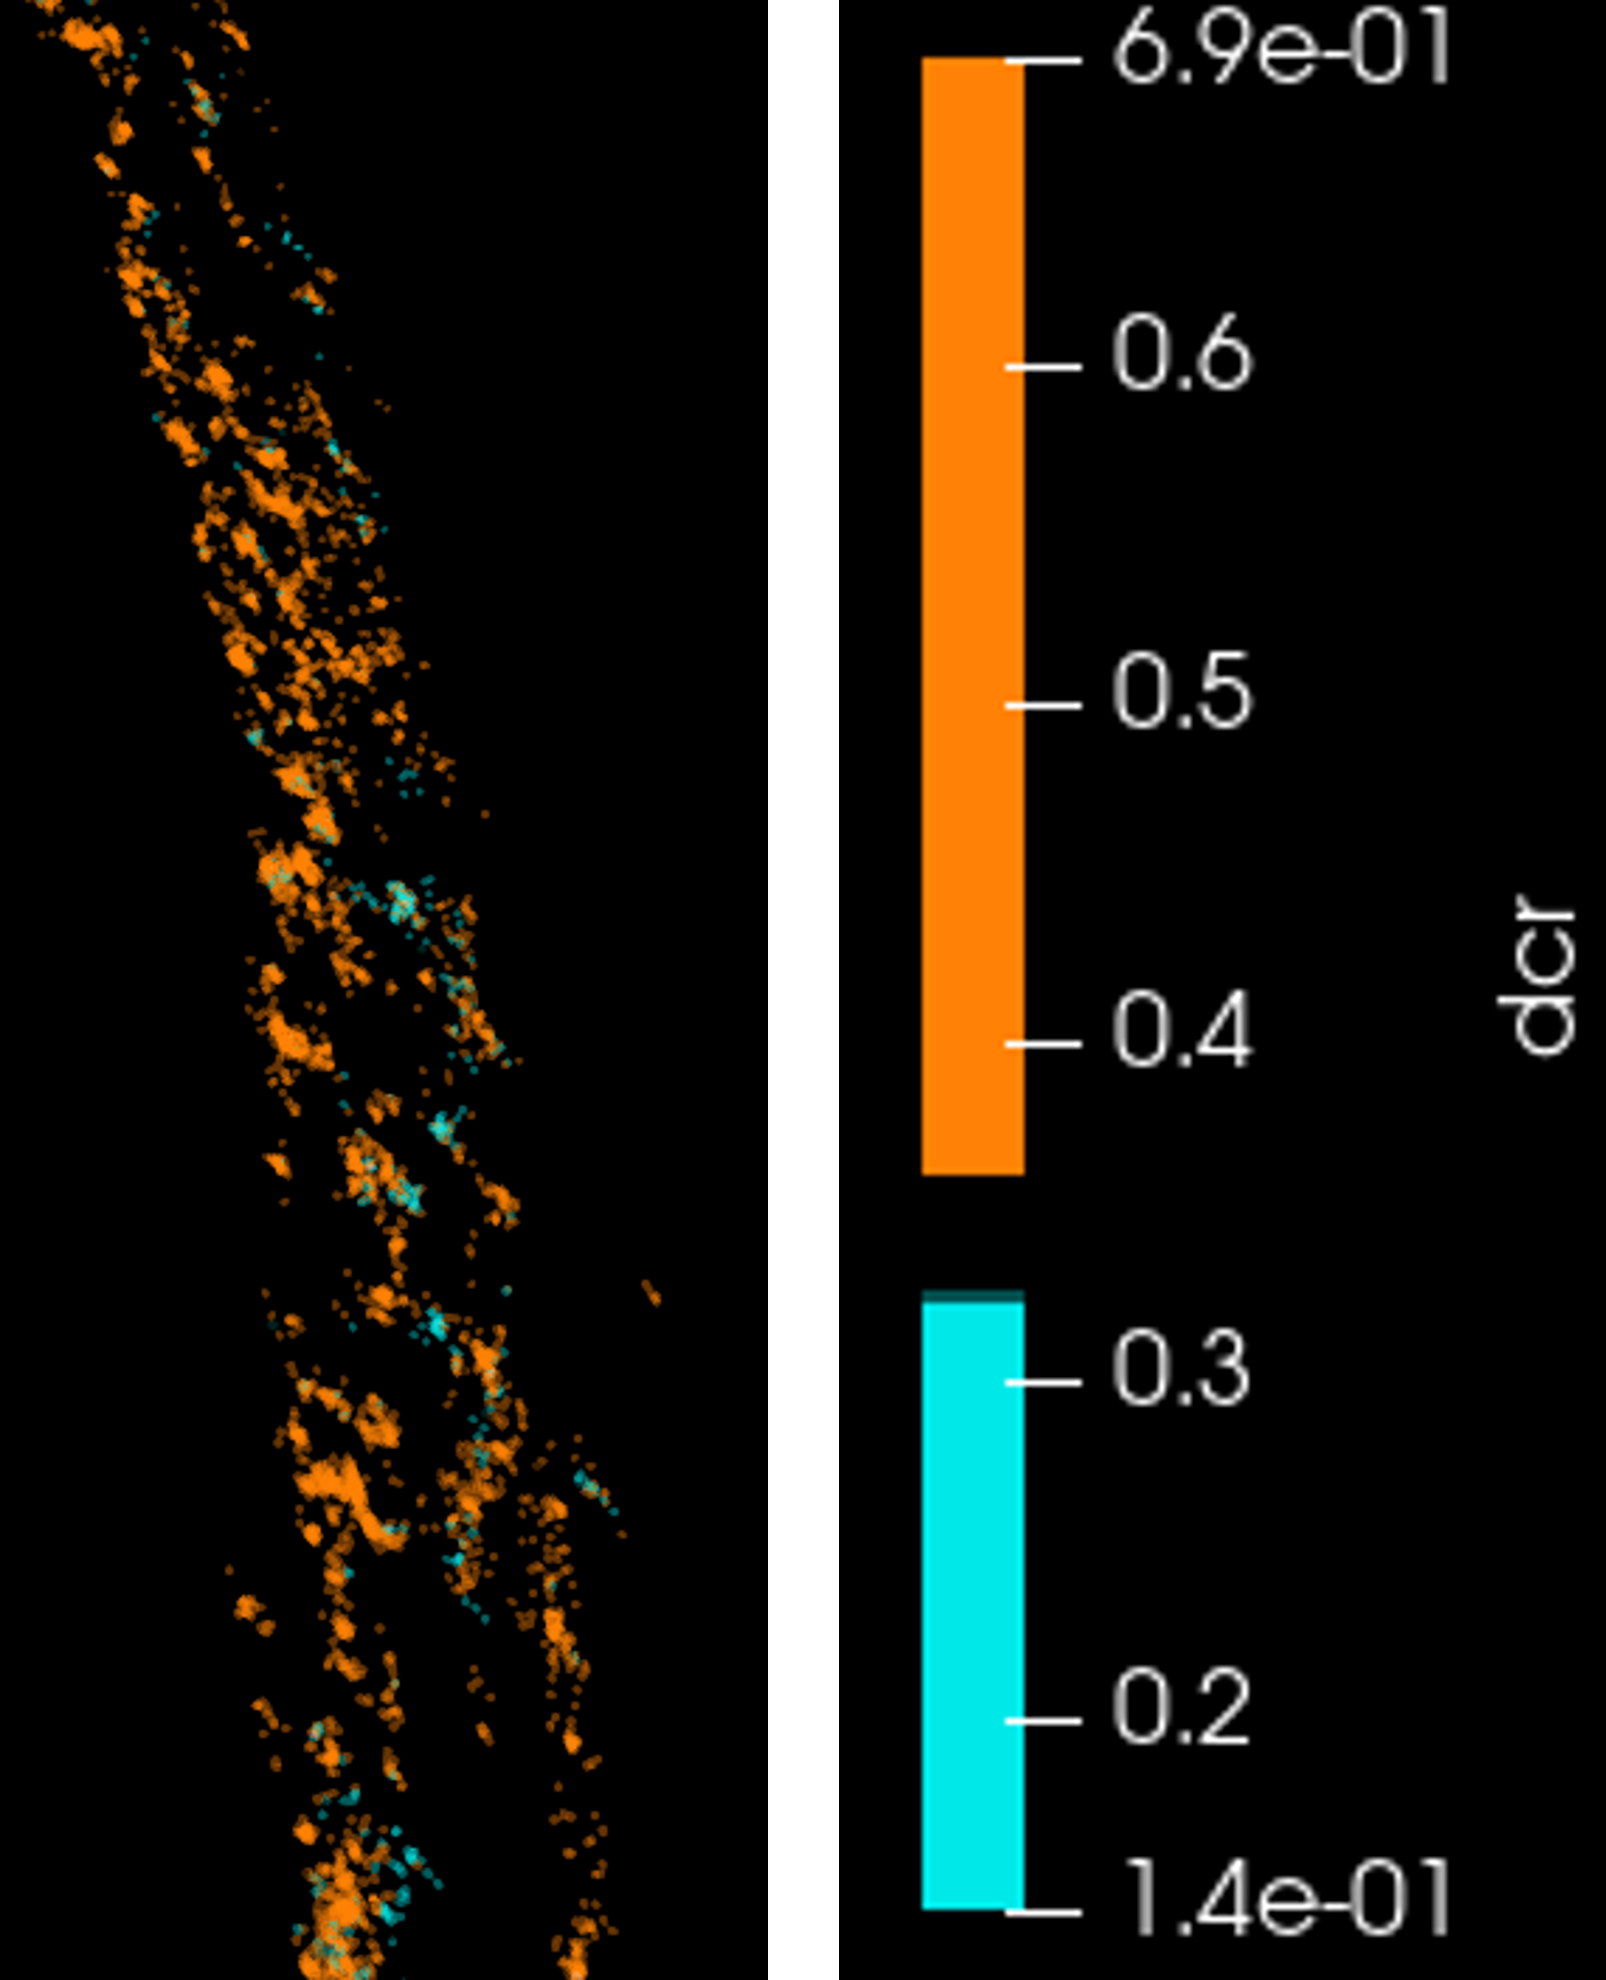
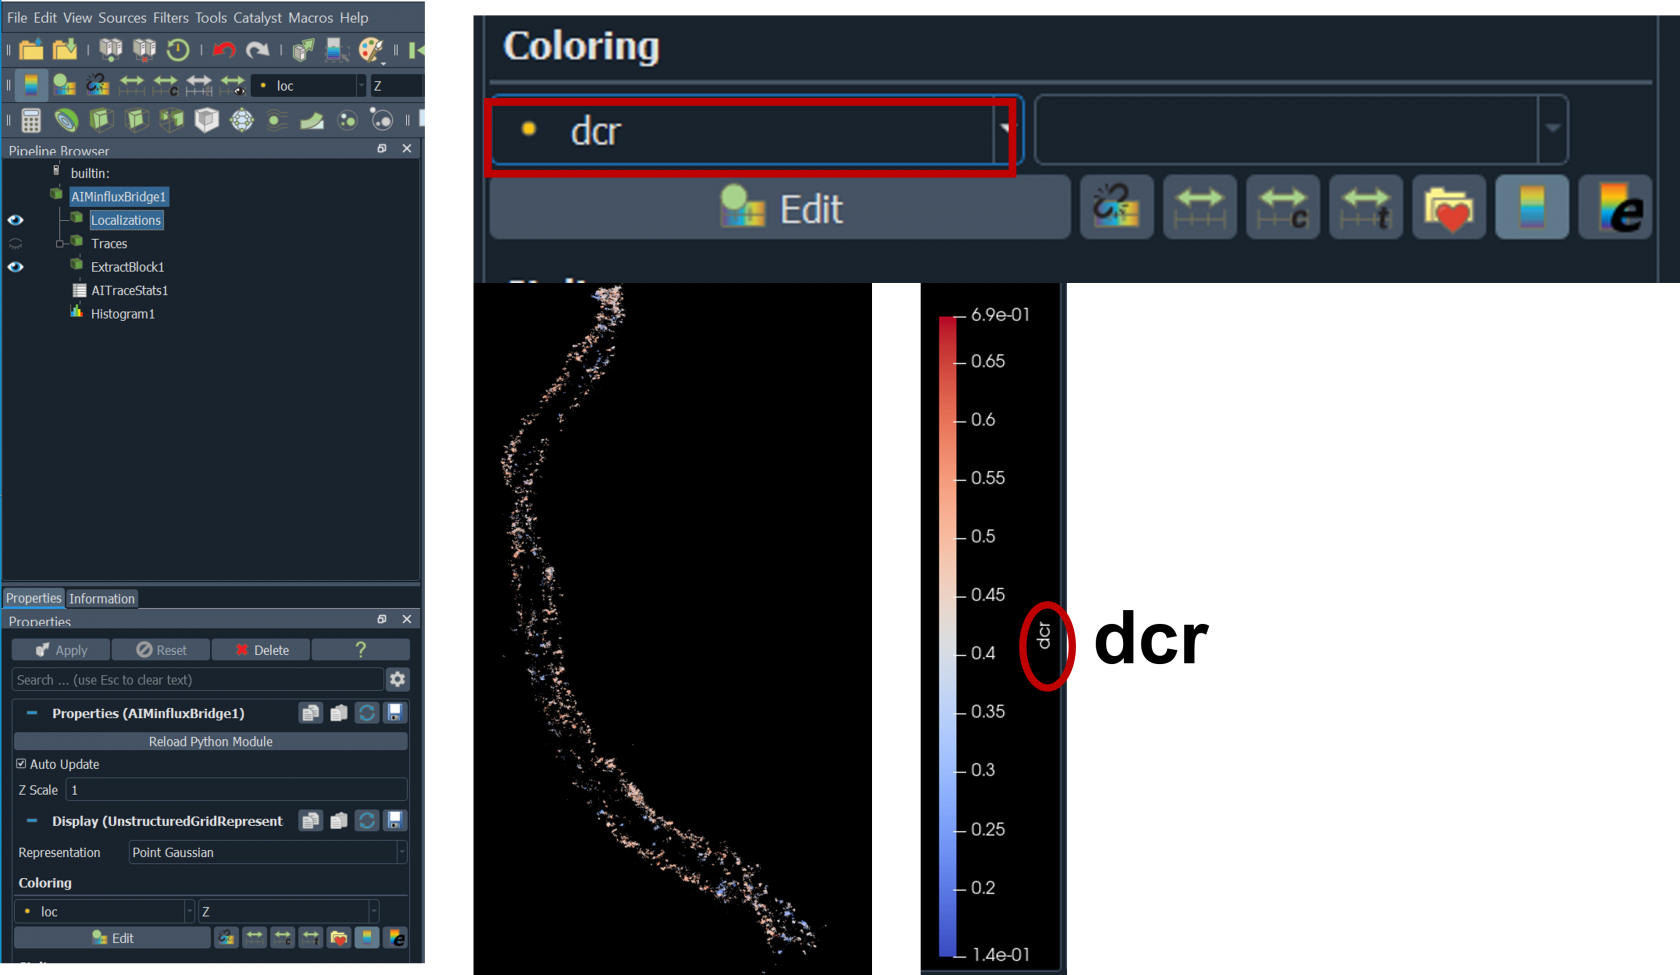
Separating two signal based on dcr (detector channel ratio) in paraview
Goal:
- to separate signal form 2 detectors (CY5 near vs CY5 far), especially when you have two dyes for example AF640 and AF680
1. Open image in Imspector
2. Minflux Data Panel → Data source: it is usually None, so you must select data source that you want to view in Paraview.
3. Minflux Data Panel → Launch Paraview 
4. in Paraview → under localization tab →select coloring to dcr (detector channel ratio)
5. in Paraview → under localization tab → click right add filter → data analysis →histogram →select input array dcr → change bin count to 100 → press apply 
- From histogram plot we can see two peaks from CY near and CY far detector, we can separate the two channels for example here we want to discard dcr value from 0.32 to 0.36

-
localizations tab: you will see color map editor or rainbow icon (edit color map) to show the color map editor
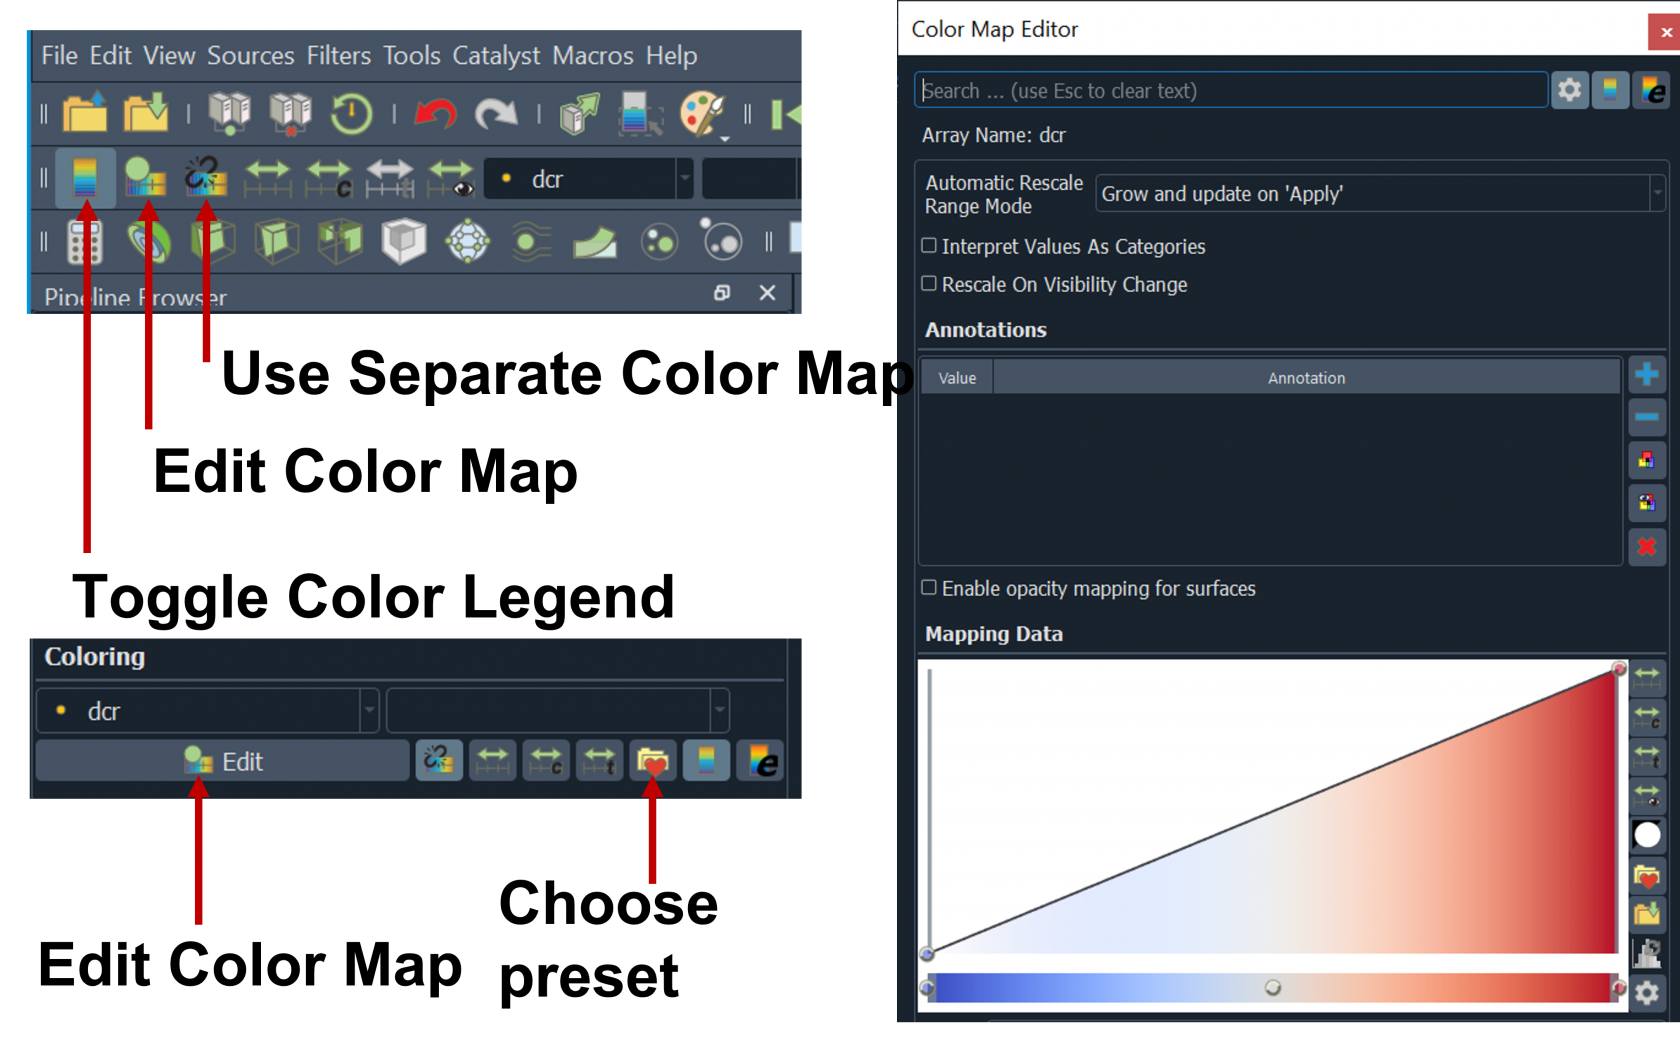
-
Choose Preset to change color map you want to use for example cold and hot and click apply
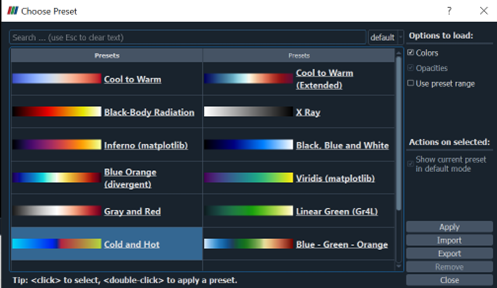
9. drag the color map (A) on the left side up (B)→ we want to discard dcr value from 0.32 to 0.36 we will set this to black color: set the left circle the lowest dcr value 0.32 (enter the value on Data and click enter) and the right circle to 0.36 → make another two circles 0.32 and 0.36 on the middle circle double click on the center of circle then select color: choose black, repeat for the left circle for example select cyan HTML#00e9e9, and for the right circle select orange HTML #ff8206
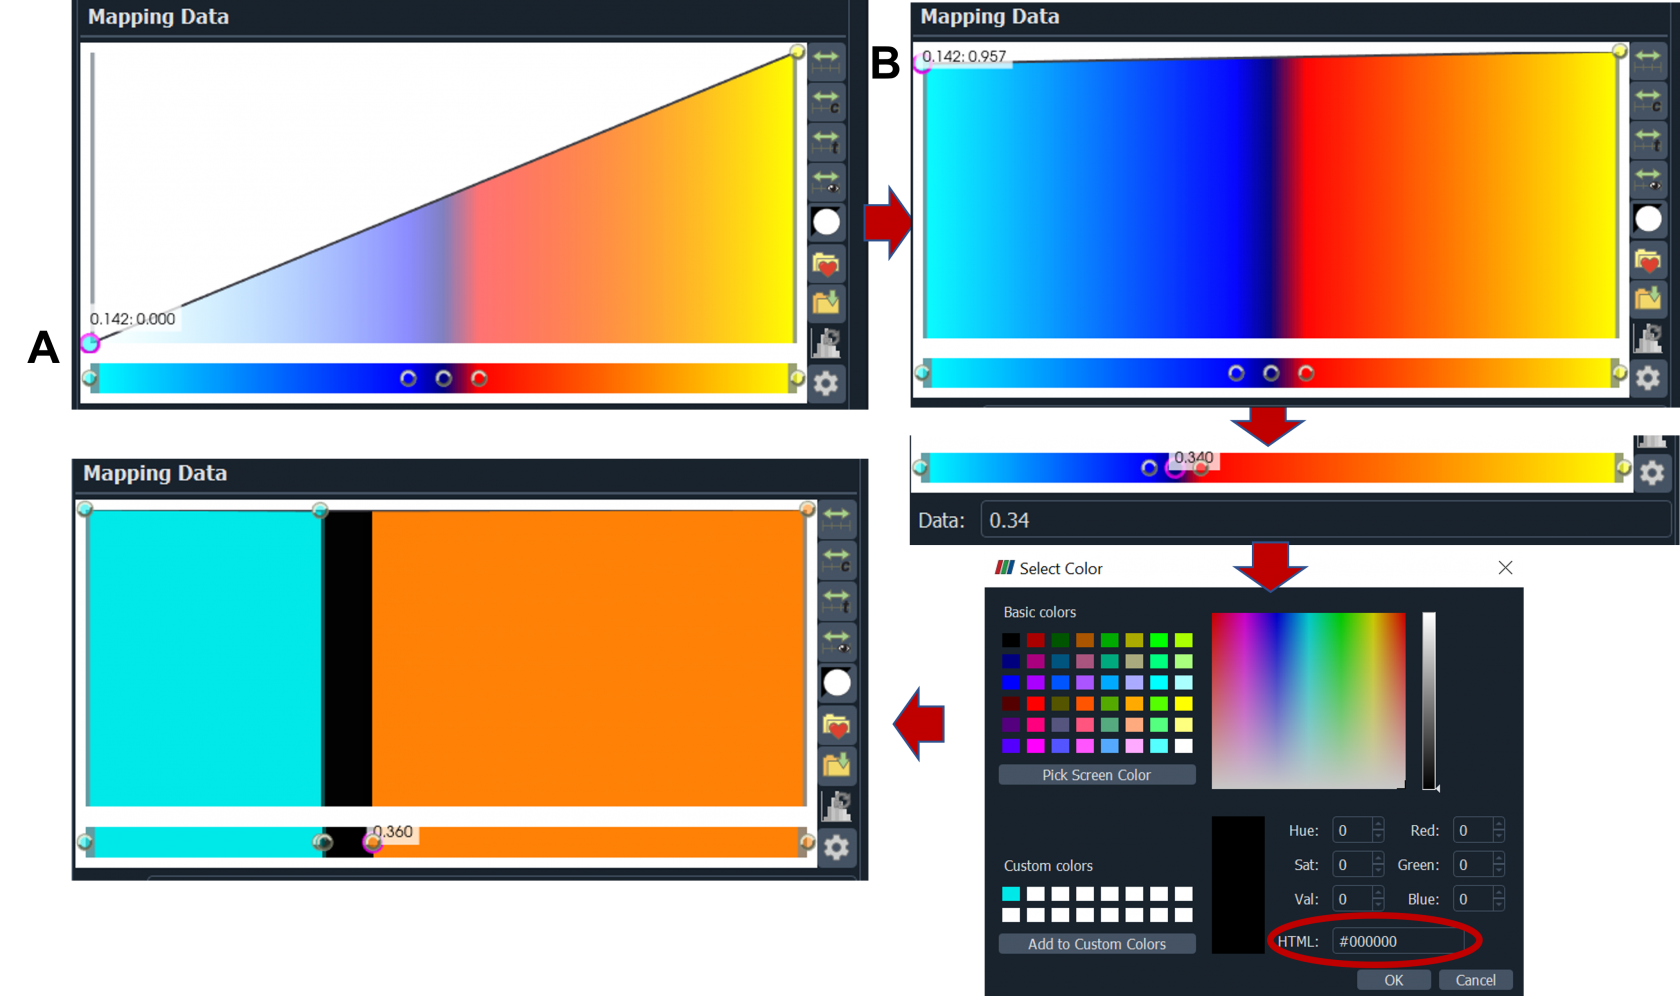
10. Signal with dcr value from 0.14 to 0.32 in cyan and dcr value of from 0.36 to 0.7 in orange
