
Axio Scan Z1
Axio Scan Z1 Operating Manual
1. Make sure the slide scanner switch on the back and on the front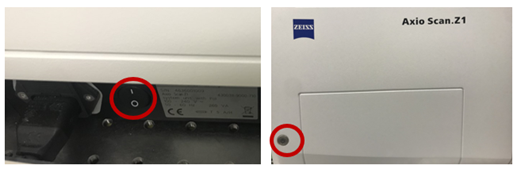
2. Login to the computer with your NETID and IGB password
3. Start ZEN blue then clicks on ZEN slidescan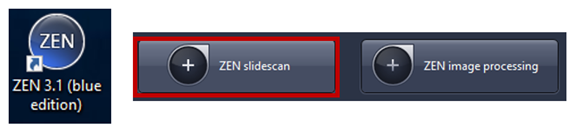
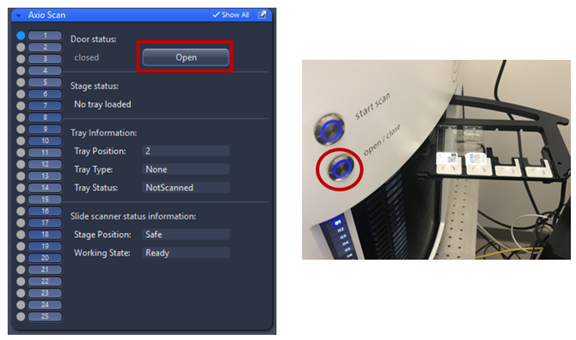
4. Load your slides into the trays, place your slides face up with the label in between holder then press the silver button on the instrument or open using Zen.
Note: occupied slots are highlighted on slide scanner in blue, green, orange, red or white.
- Blue = tray loaded and no slide preview taken. Slide status is “new”.
- Green = tray loaded and slide status is either “preview” or “finished”.
- Orange = an error occurred during scanning or tray loading.
- Red = probably a tray is stacked inside the slide scanner.
- White = tray is inserted but empty
5. Storage location: direct the folder to save your images in: D:\User Files Deleted Anytime 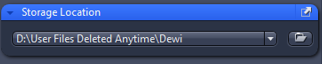
Note: After scanning, make sure you transfer your data to the core server under your PI’s NETID: \\core-server.igb.illinois.edu
6. Mark All: All slides are displayed in the Magazine tab that appears automatically when slides are loaded into AxioScan.Z1. Unmark All slides to avoid compromising other experiments. 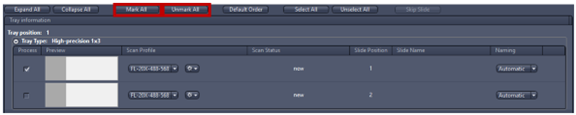
7. Select profile from default scan profile then click the gear icon to open advanced wizard and modify your settings 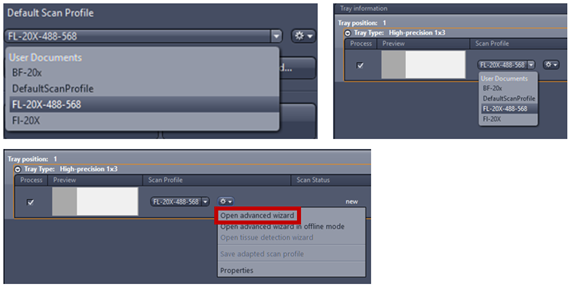
Setting Up Brightfield Scan Profile
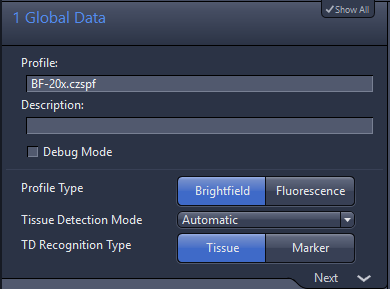
1. Global Data
- Profile Type is where you define if you are going to scan in brightfield or fluorescence
- Tissue Detection Mode should be in principle always Automatic, because compared to Interactive and Manually (the defined regions will always be the same for all slides assigned with this profile), the preview is done immediately and not after editing the tissue detection.
- TD Recognition Type for brightfield profiles should only be set to Tissue (via thresholds). This means that detection will be based on the RGB colors of your slide’s preview, compared to Marker where detection is based on the recognition of a pen contouring your section, this option is only recommended for fluorescently labeled sections, which are not visible with Preview Cam.
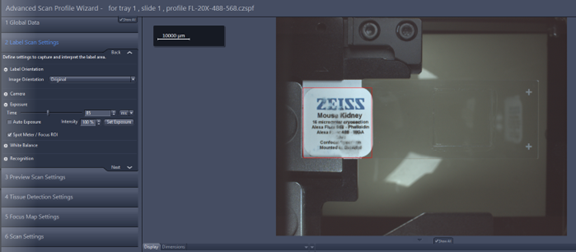
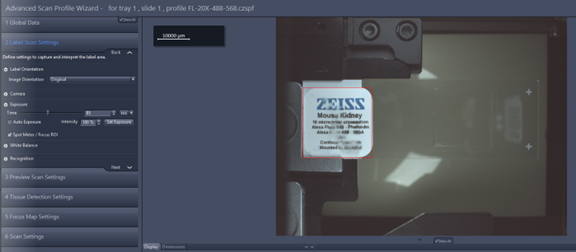
- Label Scan Settings: This tab allows you to adjust the size of the window displayed in red that defines the slide label image size and position, the image always save in separated file called pt1.
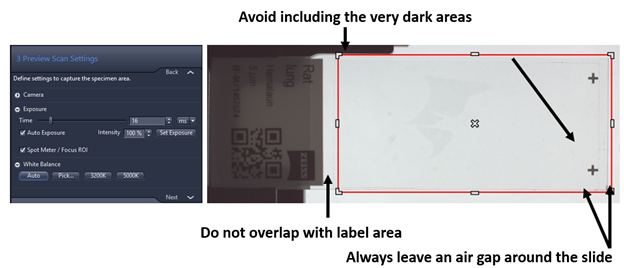
- Preview Scan Settings: the red rectangle defines the space on the slide that will be used to detect the edges of tissue detection. Note: Sometimes it is useful to reduce this area to improve the automatic tissue recognition on the slide borders, you might want to check if the predefined size corresponds to your needs. The image always saves in separated file called pt2.
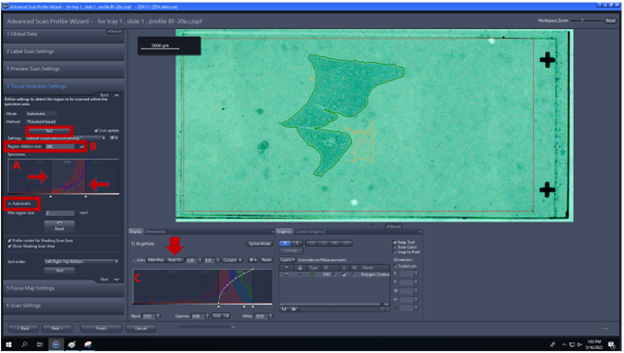
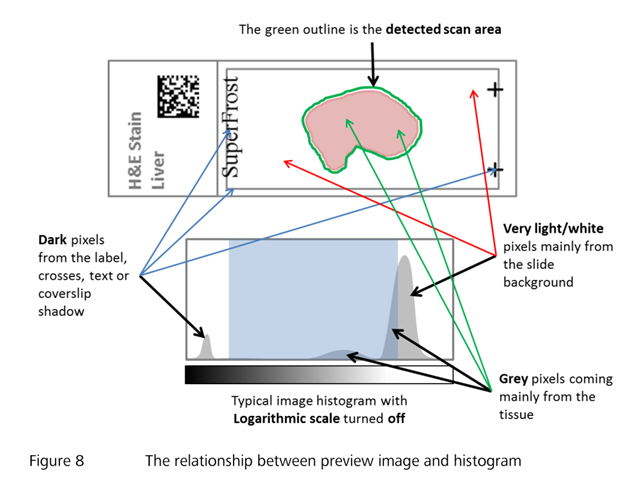
- Tissue Detection Settings: check Automatic and use Test to check the quality of the recognition. The display curve (C) can be modified to change the contrast of the image (set as best fit) and help your eyes to see the tissue clearly. The yellow ROI shows where Zen will obtain data for the shading correction. Notes: Green ROIs are defined by the following parameters (see Application guide AxioScan.Z1 v1.1):
4.A. Specimen histogram (A) can be modified to select specific intensity values (detail in fig below).
4.B. Region dilation size (B) defines a value for spacing the border around the detected tissue.

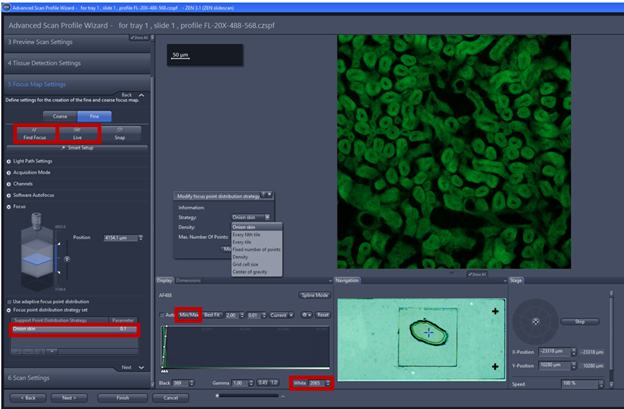
5. Focus Map Settings: Axio ascan Z1 uses a two-step focusing method (Coarse and Fine) to give the best results.
5.1. Coarse focus looks for tissue’s macroflatness, which basically means that tries to locate the section on the slide.
- lower magnification objective (5x) is recommended to generate coarse focus

- Navigate to the specimen with the tool you have in the lower part window. You can click inside the green ROI where do you want to focus or use virtual joystick within stage tab.
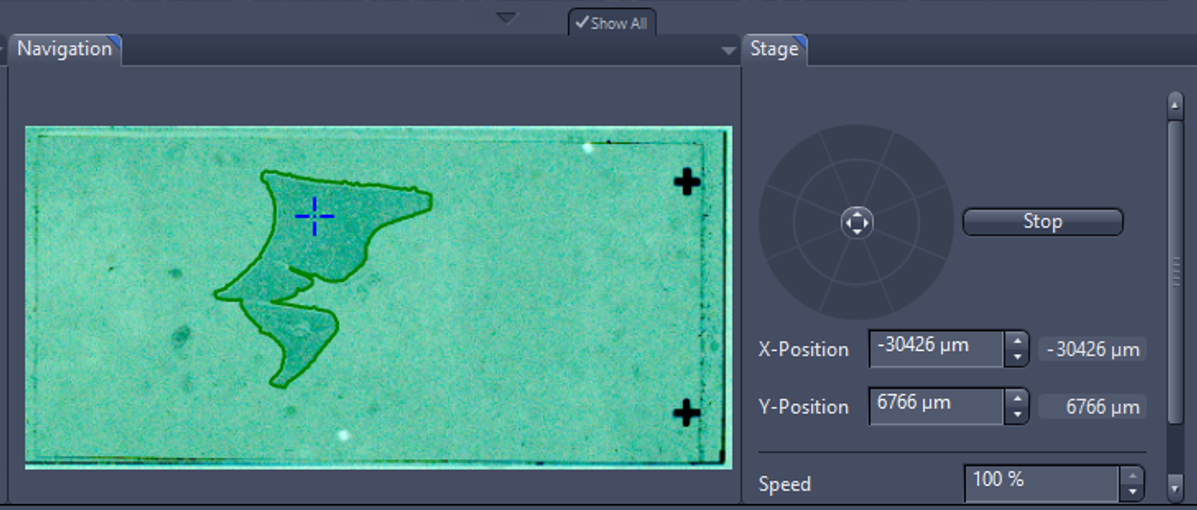
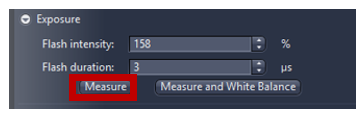
- The next step is to focus on the specimens and adjust both exposure time and light sources intensities or click measure to adjust automatically.
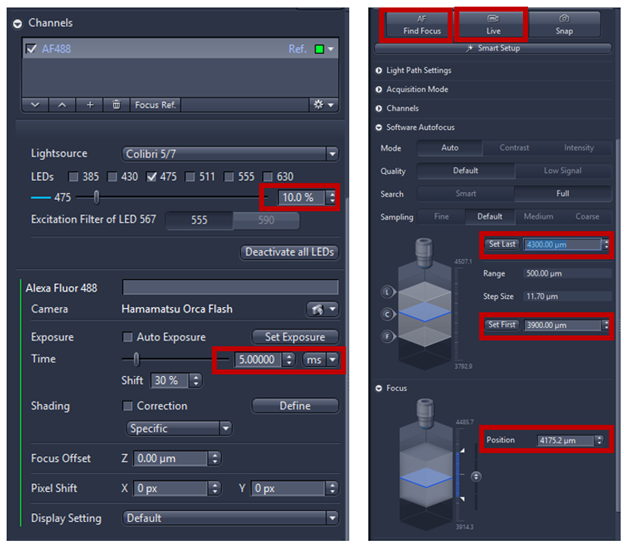
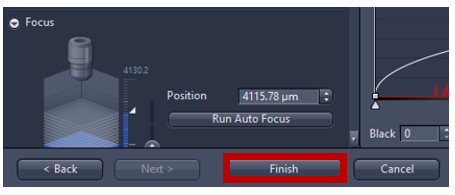
- Activate Run Auto Focus to see a live image from camera and adjust focus automatically. If the autofocus fails, focus can be adjusted manually using expander Focus. 400-600 µm range of focus is recommended (the higher the range the longer it takes to find focus). For 5X focus is typically around ~4000µm (look up current z position, in the image below the focus at 4120 µm then manually set first= position-200 µm and set last=position +200 µm) to make sure that the focus on the center of the range.
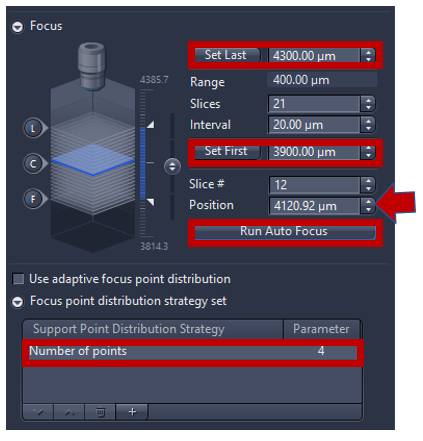
- Focus point distribution strategy: using Number of points (parameter=4-12) is the default setting to get the best value of wide variety specimens. To change the focus point distribution strategy set, double click on the entry. A window comes up, you can select other strategy and click on modify the changes will be applied. Note: Detail explanation of focus strategy for different type of tissue can be found on Application guide AxioScan.Z1 v1.1 pg 26-28. Some trial and error are always needed to fine the right compromise between speed and focus quality, in general, the flatter the sample is the better.


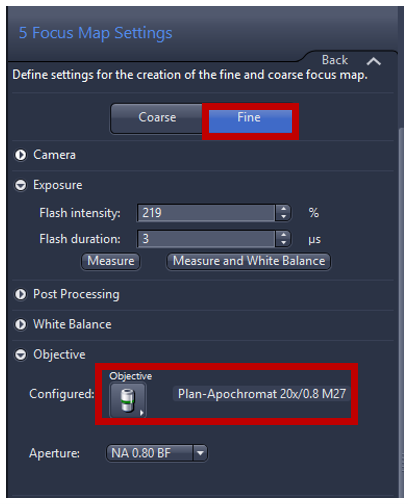
5.2 Fine focus looks for tissue’s microflatness which identify small focus within the section.
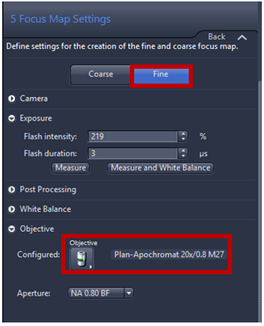
- Use the same objective for fine focus as when you scan the slide
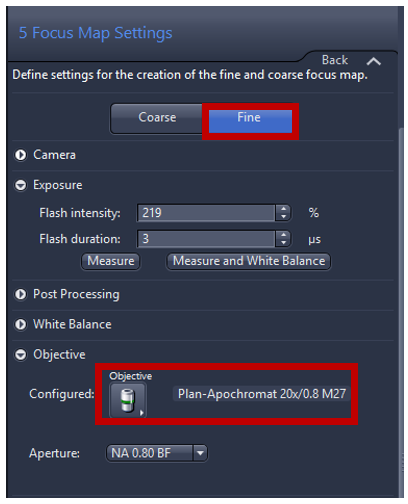
- Click Run Auto Focus to perform autofocus, or using Focus expander to adjust focus manually, in this step adjust the exposure time and/or intensity of light source to get a signal around 5% of dynamic range so you can reduce time for focusing and reduce photobleaching of the sample.
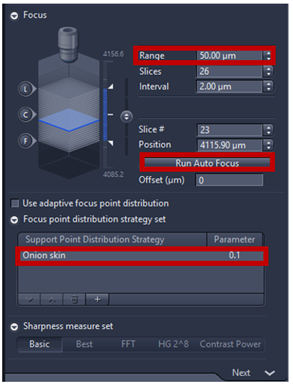
- Range coverage defines whether the complete z-stack is performed (Full) or if it is only captured until local maximum is detected first (smart). Full is more robust while smart is fastest. We recommend range of focus 50 to 100 µm (max).
- Focus point distribution strategy set: Onion skin is the standard setting for the fine focus map, providing an even distribution and ensuring the border has enough focus point, Onion skin 0.1 means that 10% of the number viewing files will be used as focus points to calculate the focus surface. Note: Onion skin strategy is particularly useful for medium and irregular tissue section under fine focus by creating concentric ring within tissue detection. Center of gravity is recommended for Tissue micro arrays. Detail of Focus point distribution strategy can be found at Application guide AxioScan.Z1 v1.1.

6. Scan Settings: Adjust the flash intensity or flash duration to get desire image for final set up. 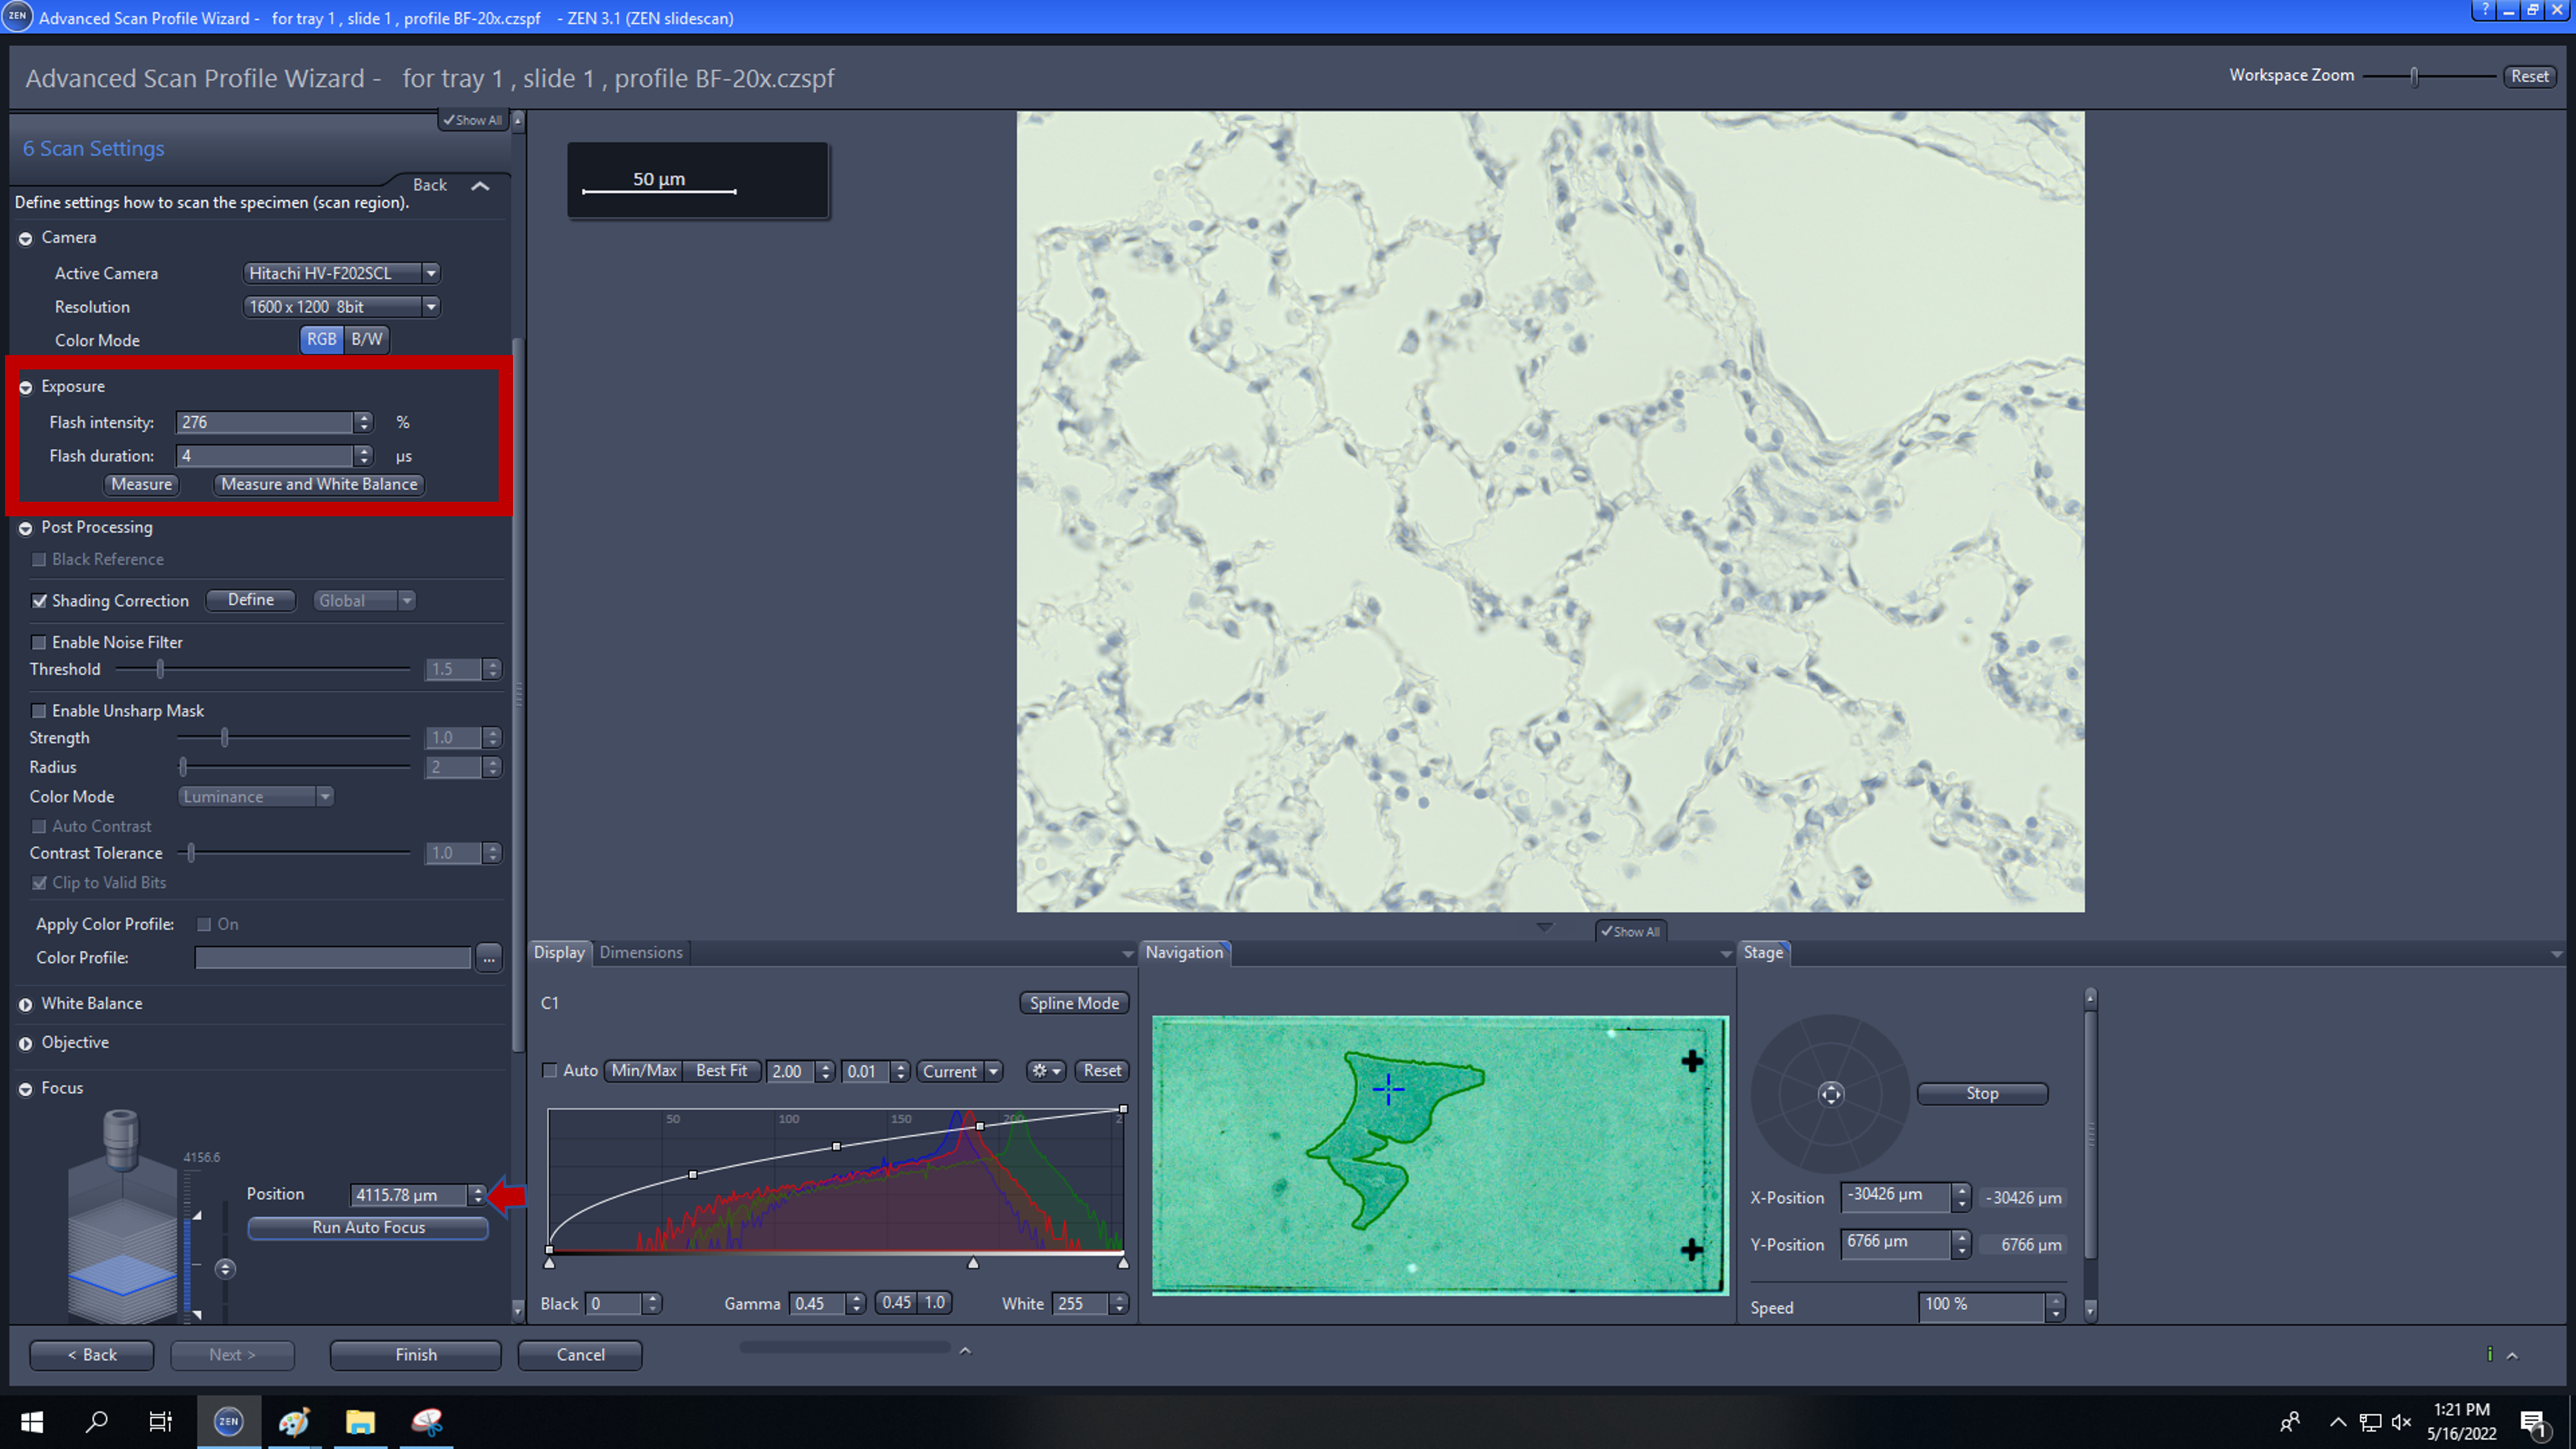
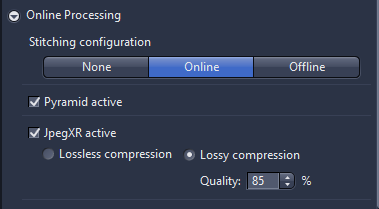
- Online processing: the standard setting is online setting as, the pyramid active should always be activated, as this will speed up the viewing the image afterwards. The final setting allows to adjust the compression which be applied as part of online processing. JpegXR active is activated via checkbox, you can save lossless compression which no information is lost If lossy compression is activated the quality should set to 85%.

- Click finish

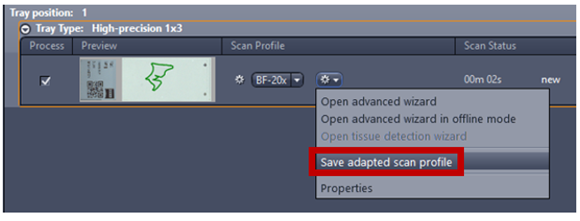
- Save the profile using Save adapted scan profile and make sure to change the scan profile to the new scan profile

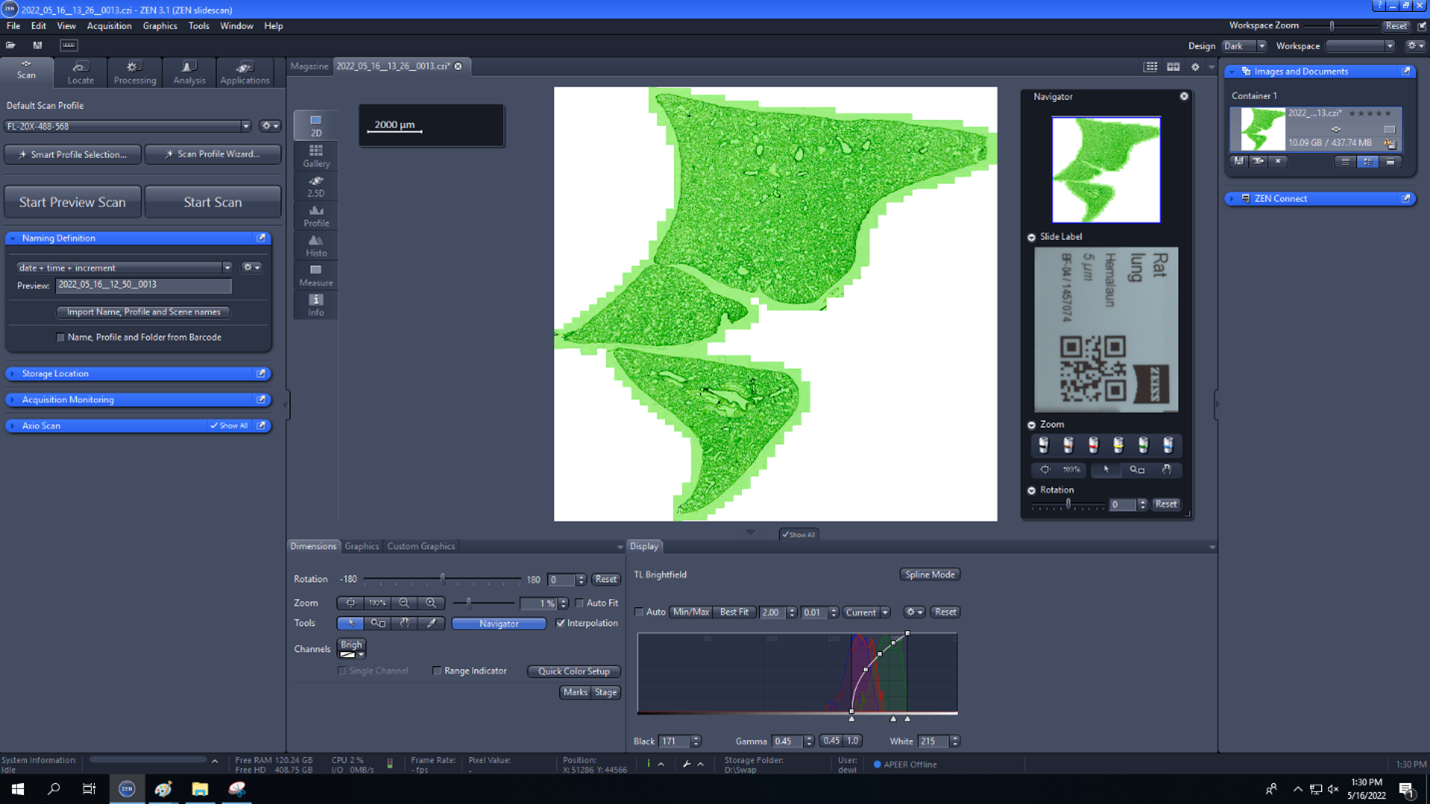
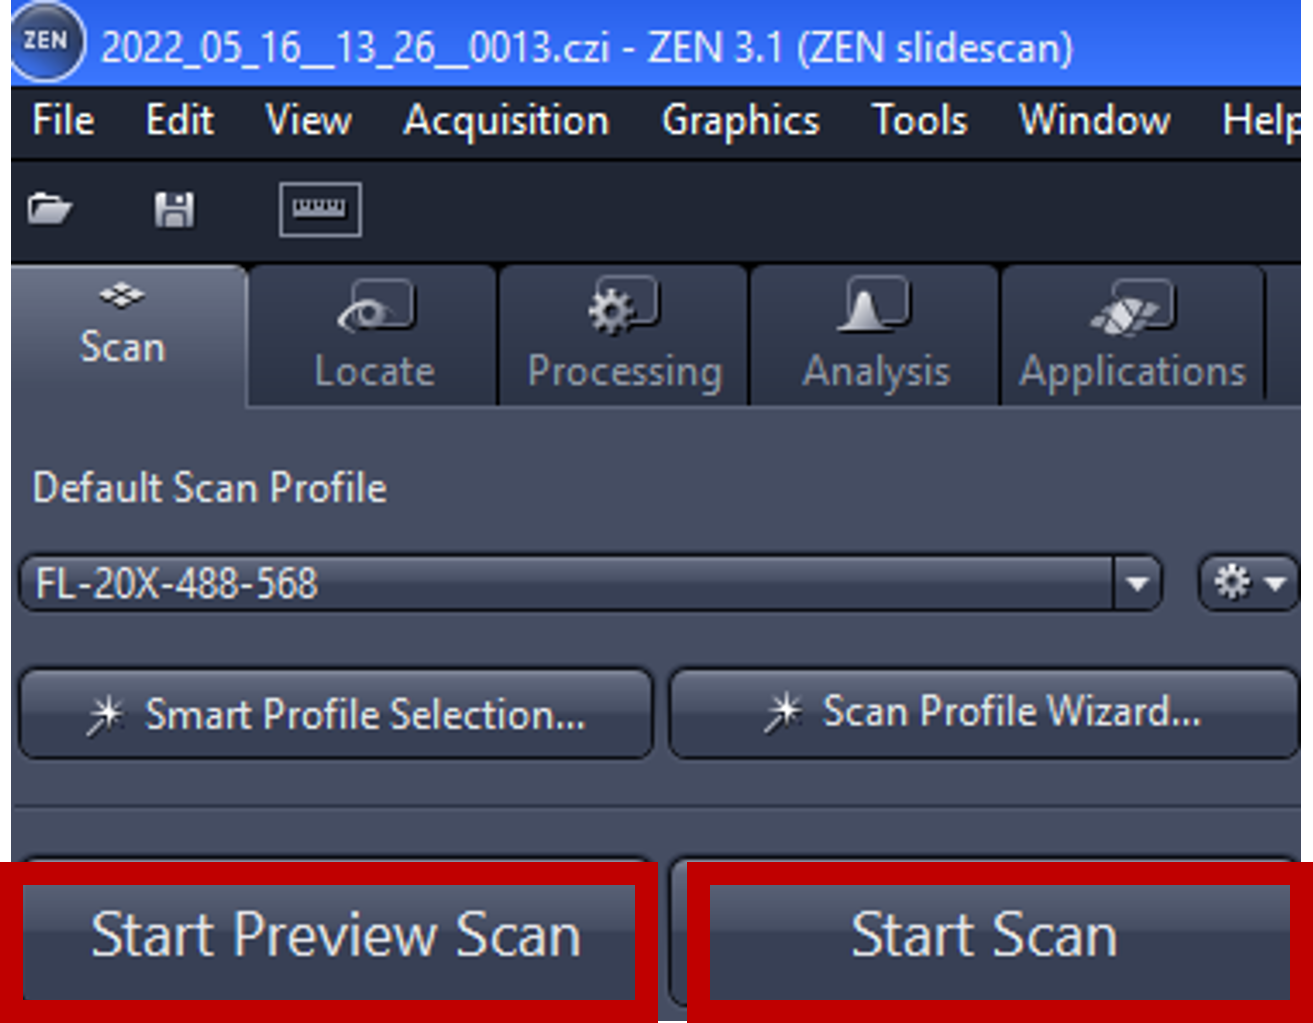
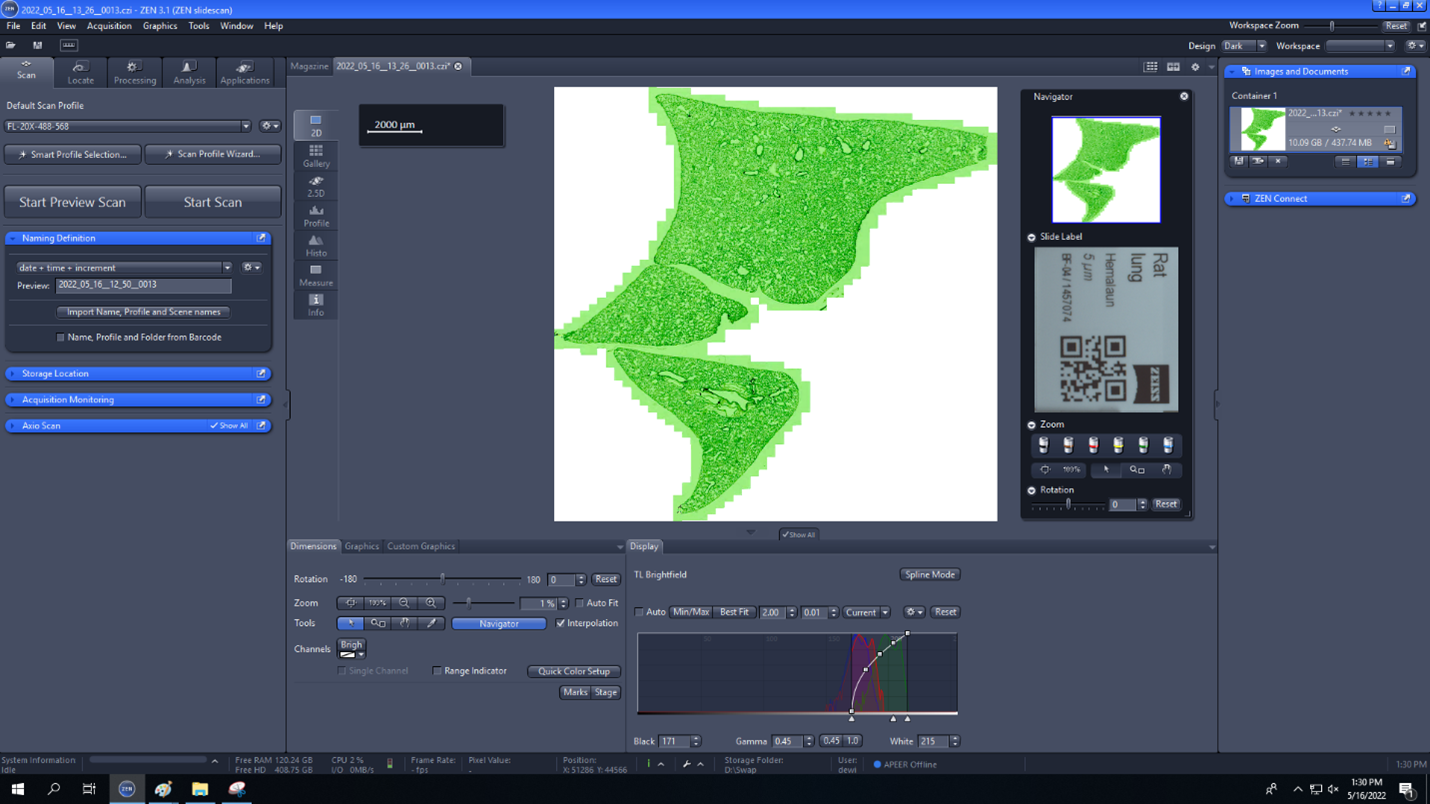
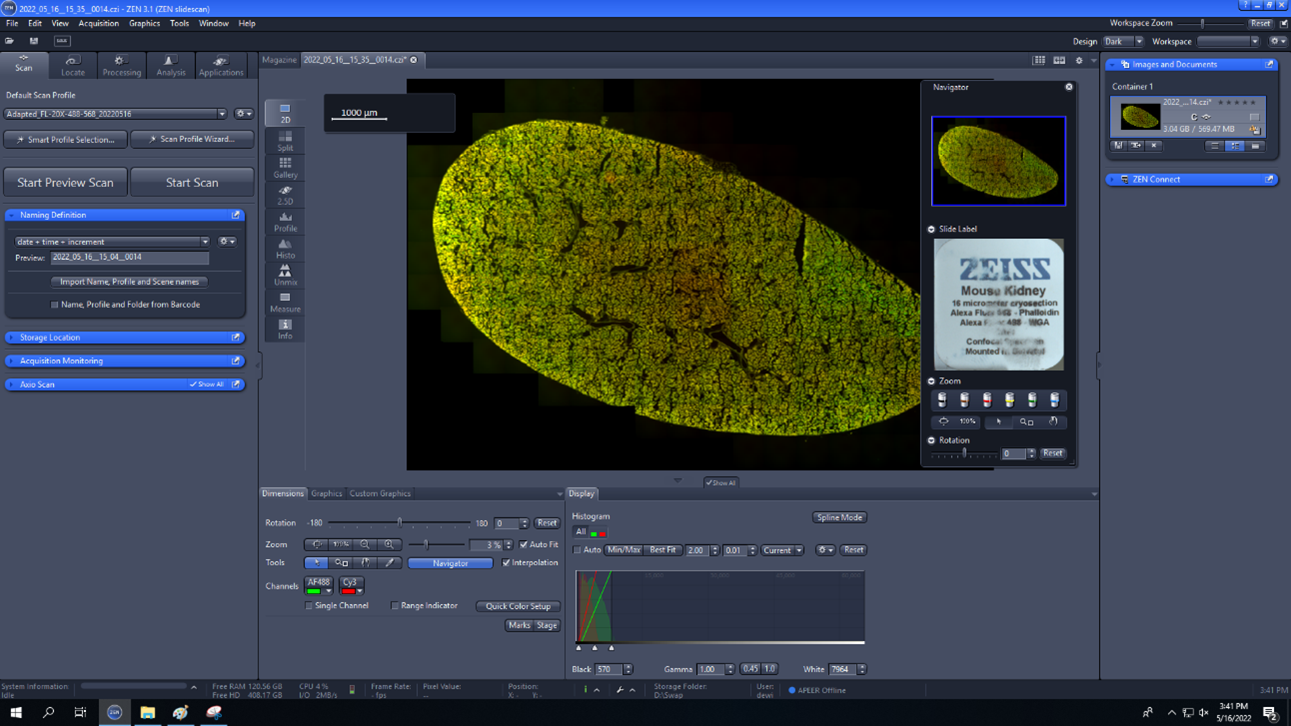
- Start Preview Scan: this setting generates the preview that will be used as defined by the assigned profile, it consists of label area and specimen area.

- Start Scan: to image the slide.
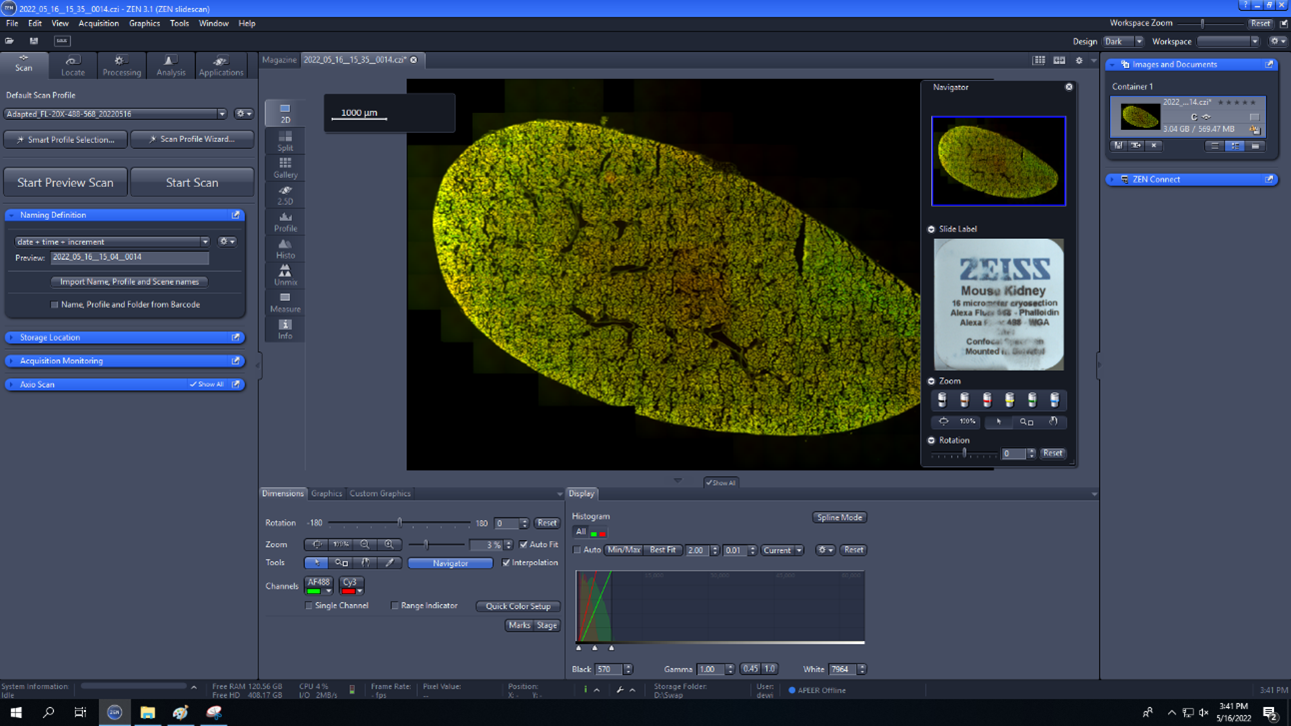
- To open the image, double click on it and it will separate open in a separate tab in the center of the screen.


Fluorescence Scan Profile
1. Global data: the profile type should be fluorescence, tissue detection mode is automatic, TD recognition type for fluorescence is marker. Channel is recommended mode for AF contrast type coarse or AF contrast type fine 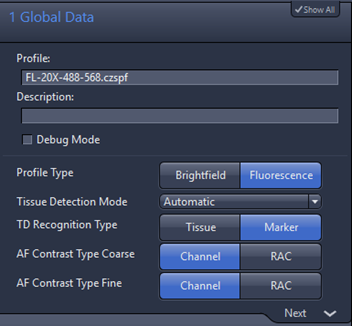
Note AF Contrast Type Coarse and Fine are channel and RAC, only for fluorescence profile.
- Channel: use fluorescence signal to perform focus with one of your florescence stains (preferably a counterstain), you must ensure that the stain evenly distributed over the sample, so the system detects enough signals at the focus point to preform reliable autofocus
- RAC: system use ring aperture contrast to perform, this recommended if no fluorescent counterstain is available and/or if fluorophore is very sensitive to bleaching.
2. Label Scan Setting 
3. Preview Scan 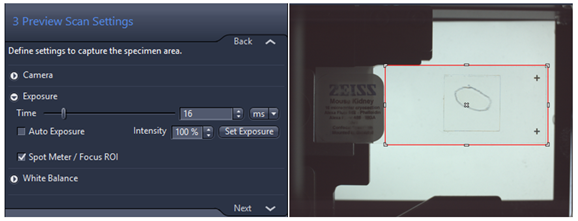
4. Tissue detection settings: check automatic and test, if green ROI does not cover your tissue, you can adjust the histogram under marker (A), region of shrink size (B), adjust the histogram on the display to best fit to see the tissue clearly (C). 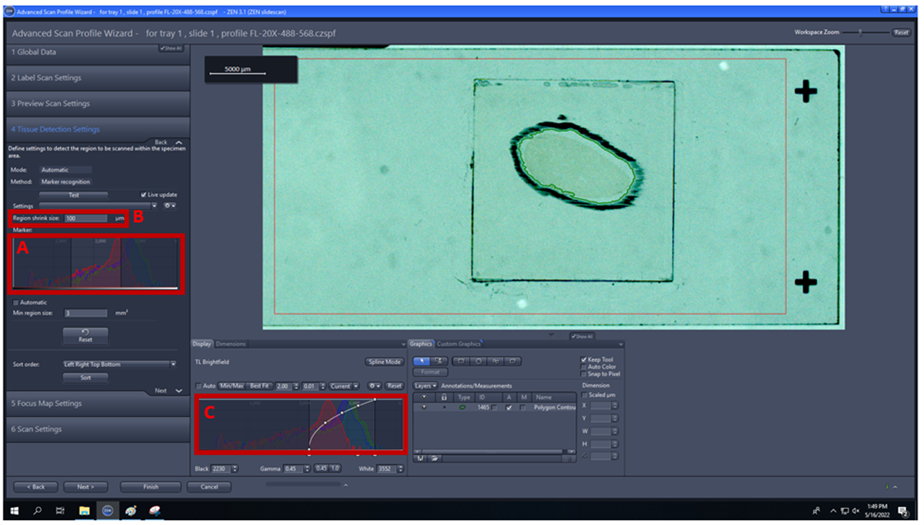
5. Focus Map Settings: Axio scan Z1 uses a two-step focusing method (Coarse and Fine) to give the best result.
5.1. Coarse Focus
- Lower magnification objective (5x) is recommended to generate coarse focus
- Choose 1 channel/fluorophore that bright and uniform on your tissue, DAPI is typically recommended as the channel to use for both coarse and fine focus. If your sample has absolutely no signal in DAPI you may use a different channel for focus reference.
- Navigate to the specimen with the tool you have in the lower part window. You can click inside the green ROI where do you want to focus or use virtual joystick within stage tab.
- The next step is to focus on the specimens and adjust both exposure time and light sources intensities, mainly adjust the exposure time to get the intensity histogram around 1000, this value is enough for focusing, which allow speed up the focus map and lower photobleaching of the sample.
- Adjust focus automatically using Find focus/AF or you can adjust manually using expander Focus if the autofocus fails. Activate Live to see a live image from camera
- Focus point distribution strategy: using Number of points (parameter=4-12) is the default setting to get the best value of wide variety specimens. To change the focus point distribution strategy set, double click on the entry. A window comes up, you can select other strategy and click on modify the changes will be applied. Note: Detail explanation of focus strategy for different type of tissue can be found on Application guide AxioScan.Z1 v1.1 pg 26-28. Some trial and error are always needed to fine the right compromise between speed and focus quality, the flatter the sample is the better.


5.2. Fine Focus
- Fine focus looks for tissue’s microflatness (small focus variation within the tissue)
- Use the same objective for fine focus as when you scan the slide for example 20X objective (minimal)
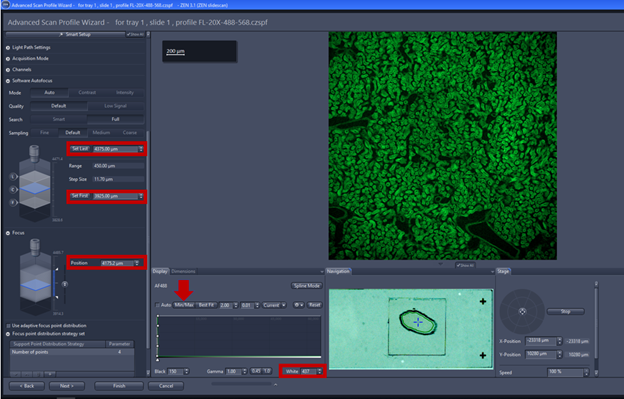
- Click Find focus (AF) to perform autofocus, or using Focus expander to adjust focus manually, in this step adjust the exposure time and/or intensity of light source to get a signal around 5% of dynamic range so you can reduce time for focusing and reduce photobleaching of the sample.
- Software autofocus: the setting under quality defines the type autofocus algorithm in use. The default setting is Quality is best and Range coverage is Full. Range coverage defines whether the complete z-stack is performed (Full) or if it is only captured until local maximum is detected first (smart). Full is more robust while smart is fastest.
- We recommend a range of focus 50 to 100 µm (max).
- Focus point strategy: Onion skin is the standard setting for the fine focus map, providing an even distribution and ensuring the border has enough focus point, Onion skin 0.1 means that 10% of the number viewing files will be used as focus points to calculate the focus surface. Onion skin strategy is particularly useful for medium and irregular tissue section under fine focus by creating concentric ring within tissue detection. Center of gravity is recommended for Tissue micro arrays. Number of points=4 for small tissue and Number of points= 6-8 points for medium size number of points 6-8 points. Note Focus point distribution strategy (see Application guide AxioScan.Z1 v1.1)

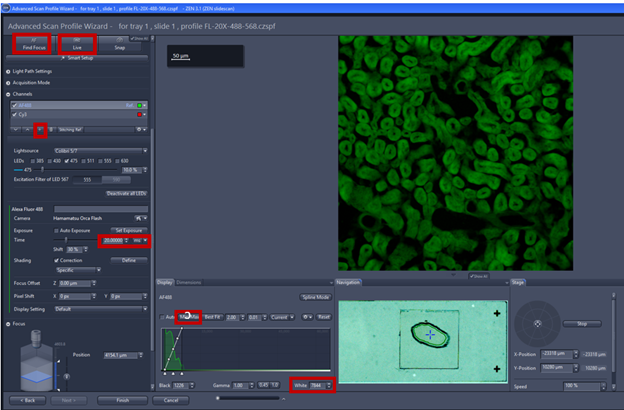
6. Scan settings:
- Add a new channel by clicking the plus sign, and choose dyes from the list, you should check that the light path if the correct filter is chosen for each fluorophore.
- Always check the tissue in a spot where you expect to have higher expression so that you can adjust exposure time to avoid saturation of the signal.
- Click find focus/AF: find the focus automatically, all the channels are displayed in the image and intensity curves are shown in the histogram
- Adjust exposure time and lamp intensity of each channel to try and use about 50% of the dynamic range.

- Online processing: the standard setting is online setting as, the pyramid active should always be activated, as this will speed up the viewing the image afterwards. The final setting allows to adjust the compression which be applied as part of online processing. JpegXR active is activated via checkbox, you can save lossless compression which no information is lost If lossy compression is activated the compression.
- Click finish

- Click the Gear Icon and save the profile using Save adapted scan profile and make sure to change the scan profile to the new scan profile
- Start Preview Scan: this setting generates the preview will be used as defined by the assigned profile, it consists of label area and specimen area.

- Start Scan: begins to image the slide.
- To open the finished image, double click on it and it will separate open in a separate tab in the center of the screen.

Tutorial videos on how to set up brightfield and fluorescence for Axio Scan Z1 by Zeiss can be found in this link https://www.zeiss.com/microscopy/us/local/zen-knowledge-base/axio-scan.html