
Introduction
Minflux is a florescence imaging and tracking technique using a 2D doughnut or 3D bottle beam to localize switchable fluorophores to single digit nanometer resolution.
Expanding on this
Minflux turns on fluorophores using a 405 laser. This allows the microscopist to control the number of active fluorophores and eliminates the situation where two active fluorophores are close together.
Minflux scans a sample with a doughnut shaped beam when an activated fluorophore is found (red star) in a field of fluorophores in a dark state (circles) the center of the excitation doughnut (green spot) moves in a hexagonal pattern 2D or octahedral pattern in 3D with a spherical excitation pattern, to determine the location of the fluorophore. The search pattern is minimized sequential.
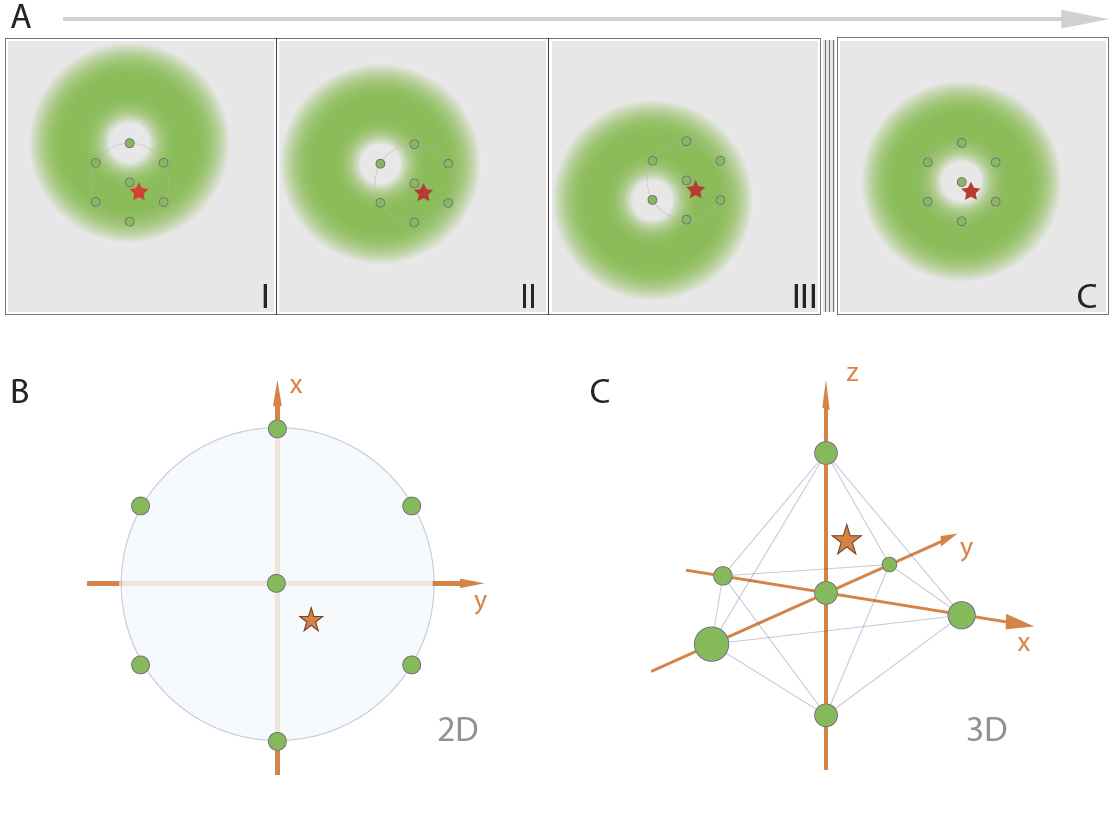
From Minflux unrivaled resolution Abberior
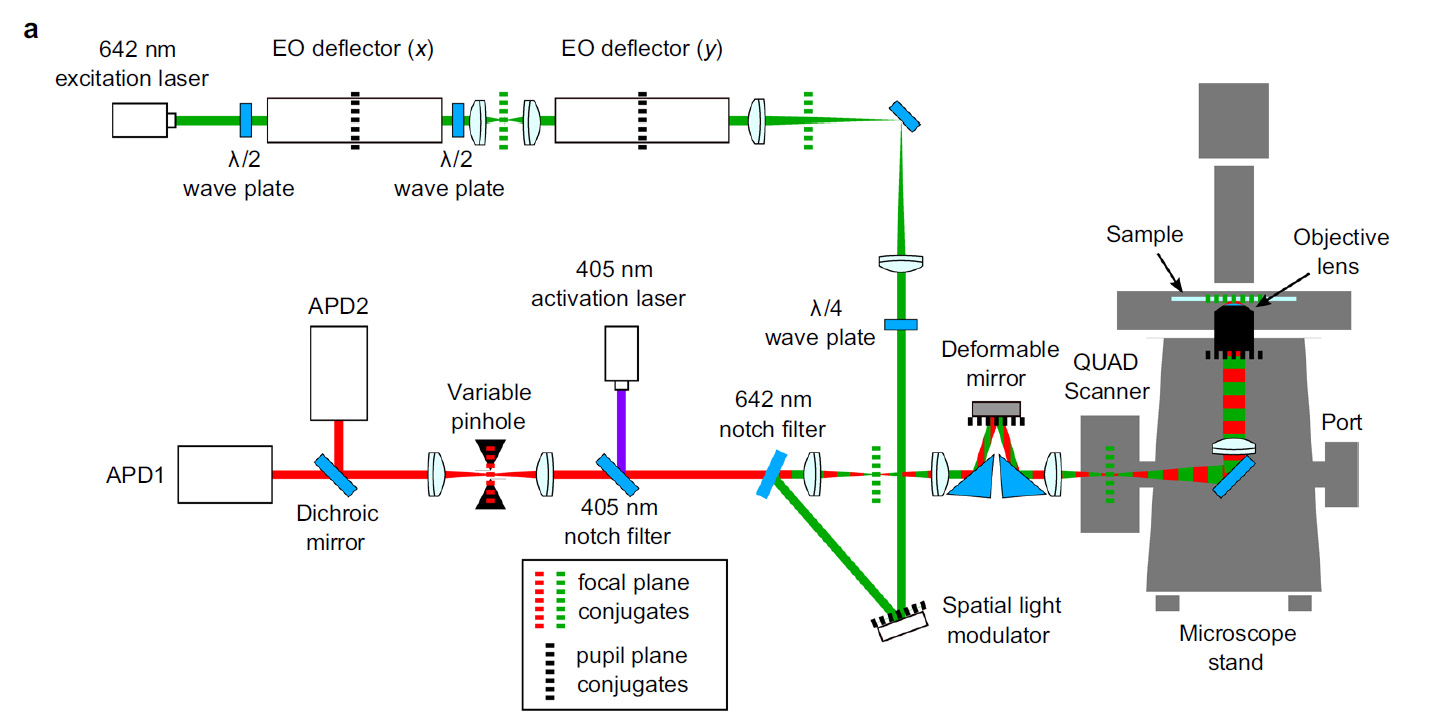
Light Path
Sample preparation
Cells are seeded on 18mm glass coverslips (No 1.5 or 1.5H); or chambered coverslips (no plastics cover slips). Fixation is done as usual (Formaldehyde or Methanol).
Minflux uses labeling techniques developed for dSTORM, so this means that Alexa fluor 647 is common. along with an oxygen scavenging GLOX buffer. β-mercaptoethylamine (MEA) is used as a blinking agent. Fiducials are also used.
Sample mounting and imaging buffers. For the sample stabilization during MINFLUX measurements, gold nanorods (A12-40-980-CTAB-DIH-1-25, Nanopartz Inc.) are used as fiducials. In brief, an undiluted dispersion of the nanorods is applied to the ready-made samples. Before mounting the samples in imaging buffer, the coverslips are rinsed several times with phosphate buffered
saline (PBS) to remove unbound nanorods. For MINFLUX imaging of samples labeled with Alexa Fluor 647, GLOX buffer (50mM TRIS/HCl, 10mM NaCl, 10% (w/v) Glucose, pH 8.0, 64 μg/ml catalase, 0.4 mg/ml glucose oxidase, 10–25mM MEA) is used. Samples are sealed with twinsil (picodent). Ref 1
Labeling Dyes
Live Cell Imaging (PALM) and Single Molecule Tracking:
- Photo-switchable Organic Dyes/ Proteins, e.g., Janelia Fluor 549 or 646 dyes (Tocris)
- Photoconvertible Oganic Dyes/ Proteins, e.g., mMaple (plasmids sold by Allele Biotechnology)
Fixed Cell Imaging (dSTORM):
-Carbocyanine dyes (sCy, ATTO, Alexa Fluor or Flux dyes may be used). Various dyes excited at 640 nm, such as Alexa Fluor 647, CF660C, CF680 or sCy5 can be used. Best Dye: Alexa 647 or Flux 647 for one color and sCy5 + CF680 or Flux 640 + Flux 680 (recommended) for 2 color-imaging.
Intracellular/Surface Live Cell Imaging (dSTORM):
- SNAP, CLIP or Halo-tags for single color live cell imaging
- SNAP & CLIP-tags for 2-color
- SNAP & Halo-tags for 2-color (preferred if already in cell line)
- Nanobodies (Proteintech)
No DAPI or Hoechst staining in sample. Labeling density should be very low (dilute antibodies 1:500 to 1:1000) to avoid over-labeling.
Background labelling: there should be no background.
- increase blocking steps & times
- increase washing steps & times
- reduce antibody concentrations
Stabilization
Sub nanometer stabilization is required to measure the location of a fluorophore to nm resolution. This system preforms to 0.39nm in x and y and 0.6nm in Z. This performance is impressive since 980nm light is used.
980nm light (easily passes through tissue) passes through a half wave plate to rotate polarization and then through a polarizing beam splitter and relay lens to focus on the back aperture of the lens. A quarter wave plate changes the linearly polarized light to right-handed circularly polarized light. Reflected left-handed circularly polarized light changes to vertically polarized light and passes through the polarizing beam splitter, a spacial filter and travels to the camera. The spacial filter removes low spacial frequency information from the image.
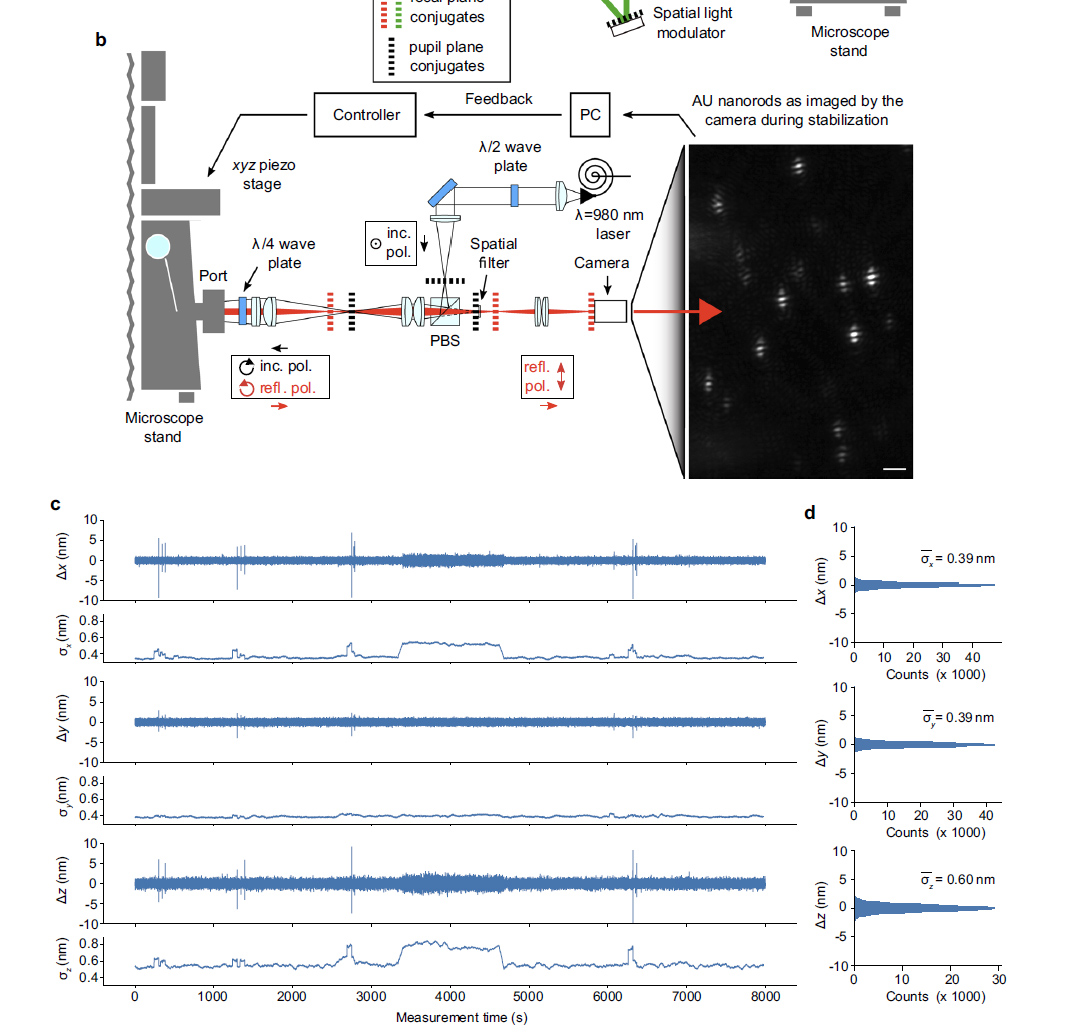
figure from Ref 1
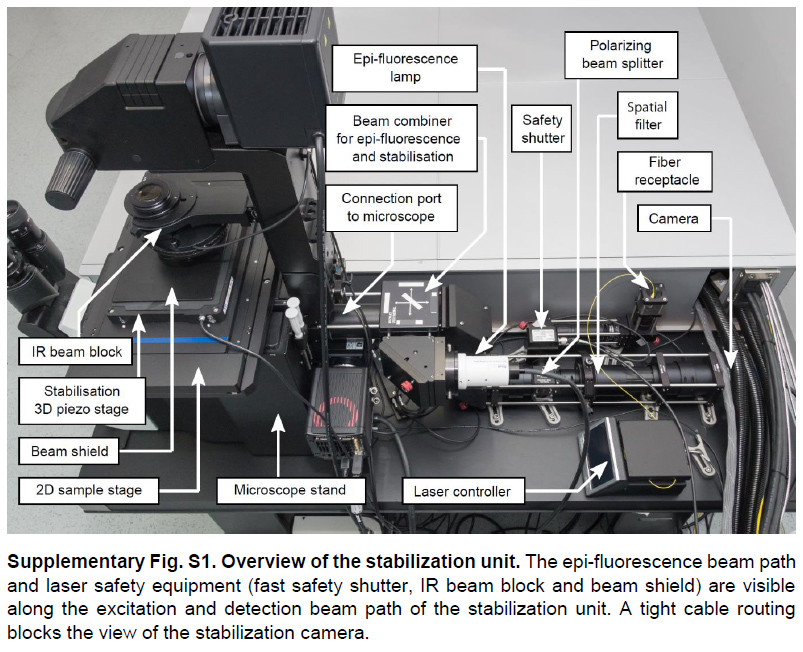
from supplement
gold nanorods rotating force: https://www.osapublishing.org/oe/fulltext.cfm?uri=oe-22-21-26005&id=303075
References
1 Schmidt R., et al. (2021) MINFLUX nanometer-scale 3D imaging and microsecond-range tracking on a common fluorescence microscope. Nat Commun., 12(1):1478.
2 Balzarotti, F. , et al. (2017). Nanometer resolution imaging and tracking of fluorescent molecules with minimal photon fluxes. Science, 355(6325), 606–612.